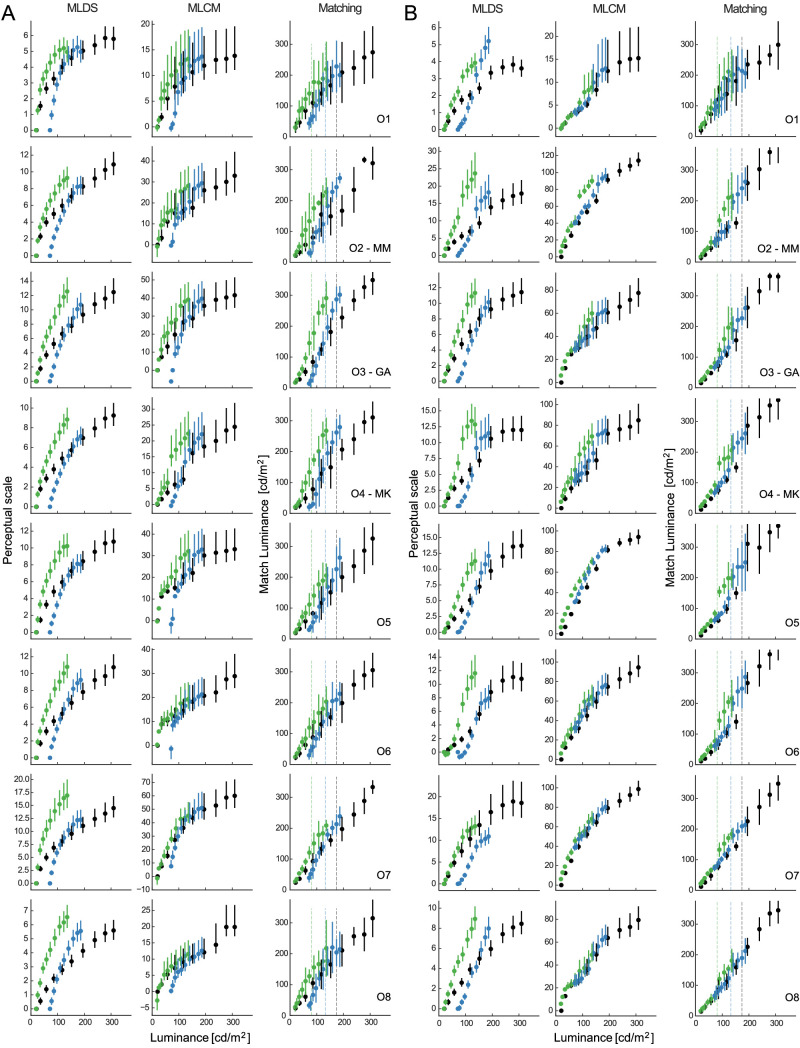
Figure 5.
Results from MLDS, MLCM, and matching experiments for observers judging (A) variegated checkerboards and (B) center-surround stimuli. Observers were sorted according to the similarity between MLDS and MLCM scales for the variegated checkerboards. Errorbars are 95% CI for MLDS and MLCM scales, and ± 2 SD for matching. Color legend as in Figure 4. Scales’ maxima relate inversely to the noise in the judgments estimated by MLDS or MLCM (see Noise estimation section).

