
Figure 2.
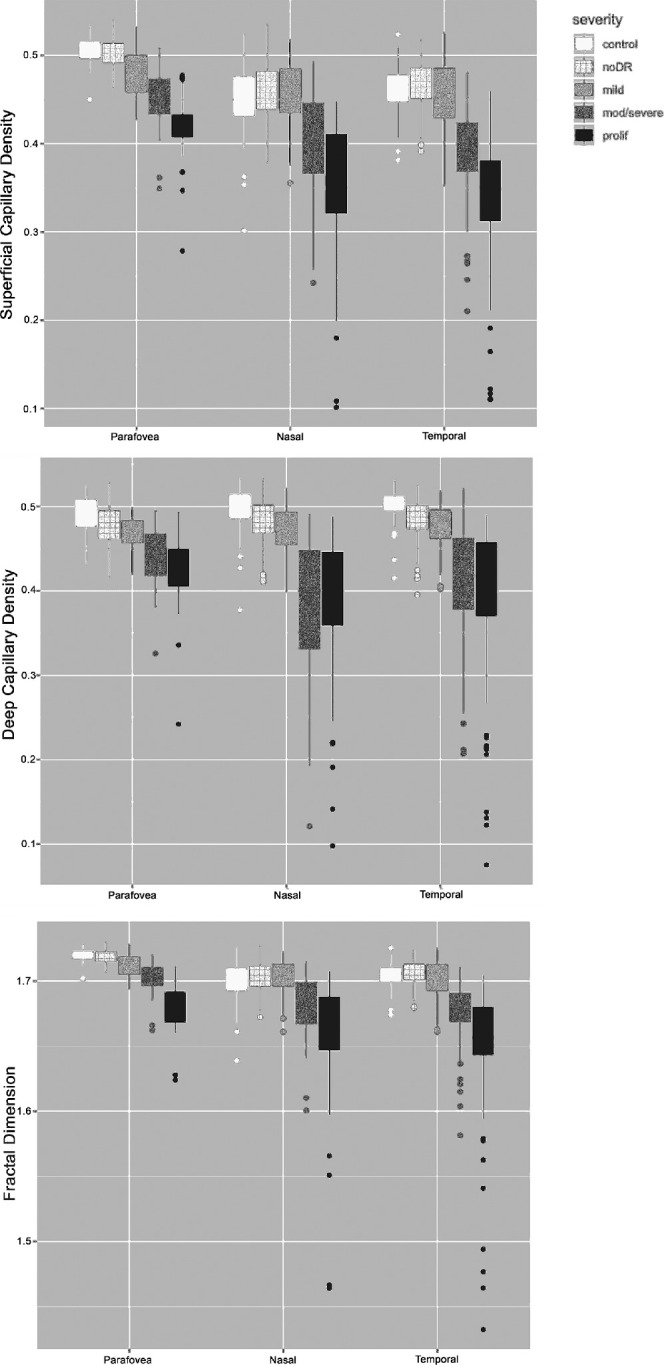
Plot of the three main outcomes (perfusion density of the superficial and deep capillary plexus as well as fractal dimension of the superficial capillary plexus) for each severity level of diabetic retinopathy grouped by retinal topography of the scanning pattern. The nasal and temporal areas show overall higher variability in each outcome compared to the center. Similarly, the difference between mild and moderate/severe diabetic retinopathy is best visible in the nasal/temporal areas. The bottom and top of each box are the 25th (Q1) and 75th (Q3) percentile, respectively. The upper and lower whiskers are Q1 – 1.5 interquartile range (IQR) and Q3 + 1.5 IQR, respectively.