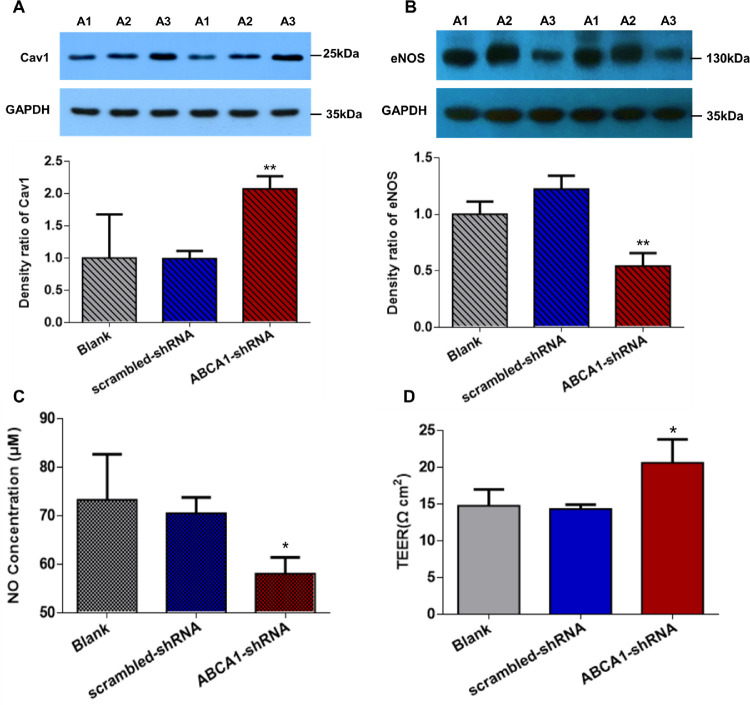
Figure 4.
Cav1 and eNOS expression in AAP cells transduced with ABCA1–shRNA lentivirus. (A, B) Western blot showed upregulated Cav1 and downregulated eNOS in ABCA1–shRNA transduced AAP cells (n = 3 cell lines). (C) Griess assay showed that NO concentration was significantly lower in the ABCA1–shRNA transduced AAP cells compared with scrambled control transduced AAP cells (n = 3 cell lines). (D) TEER of AAP monolayer was notably higher in the ABCA1–shRNA transduced cells compared with scrambled shRNA transduced cells (n = 3 cell lines). A1, blank; A2, scrambled shRNA; A3, ABCA1–shRNA. *P < 0.05, ** P < 0.01 compared with scrambled shRNA groups. A, B, and C were analyzed using one-way ANOVA. D was analyzed using the Mann-Whitney U test.

