


Figure 8.
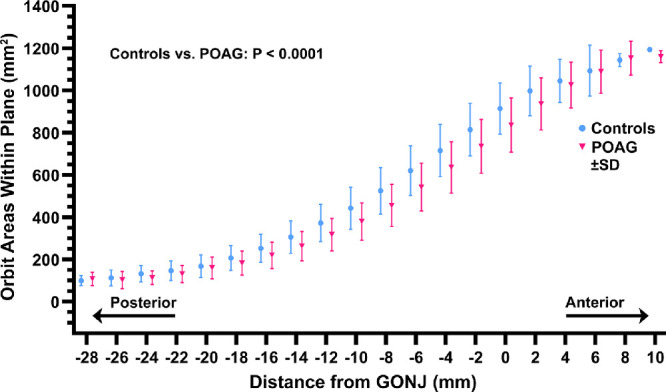
Mean cross-sectional area of the orbit along its anteroposterior extent in patients with POAG and controls. Except at the extreme ends of the orbit, cross-sectional area was significantly less in POAG than in controls. Differences between groups were significant at P < 0.0001 by ANOVA. SD, standard deviation.