


Figure 9.
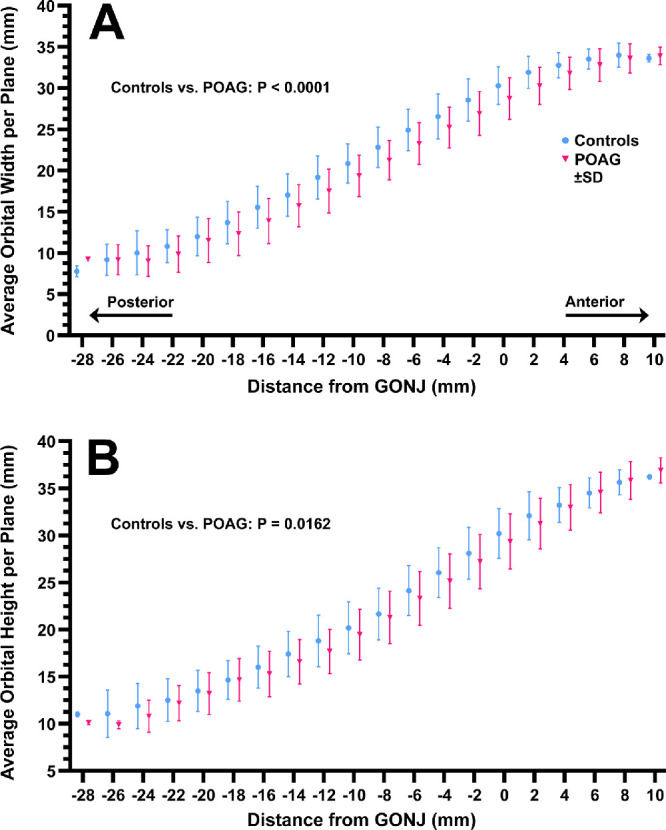
Mean orbital dimensions along the anteroposterior extent of the orbit in patients with POAG and controls. (A) Width. (B) Height. Differences between groups were significant at P < 0.0001 by ANOVA. SD, standard deviation.
Official websites use .gov
A
.gov website belongs to an official
government organization in the United States.
Secure .gov websites use HTTPS
A lock (
) or https:// means you've safely
connected to the .gov website. Share sensitive
information only on official, secure websites.
Mean orbital dimensions along the anteroposterior extent of the orbit in patients with POAG and controls. (A) Width. (B) Height. Differences between groups were significant at P < 0.0001 by ANOVA. SD, standard deviation.