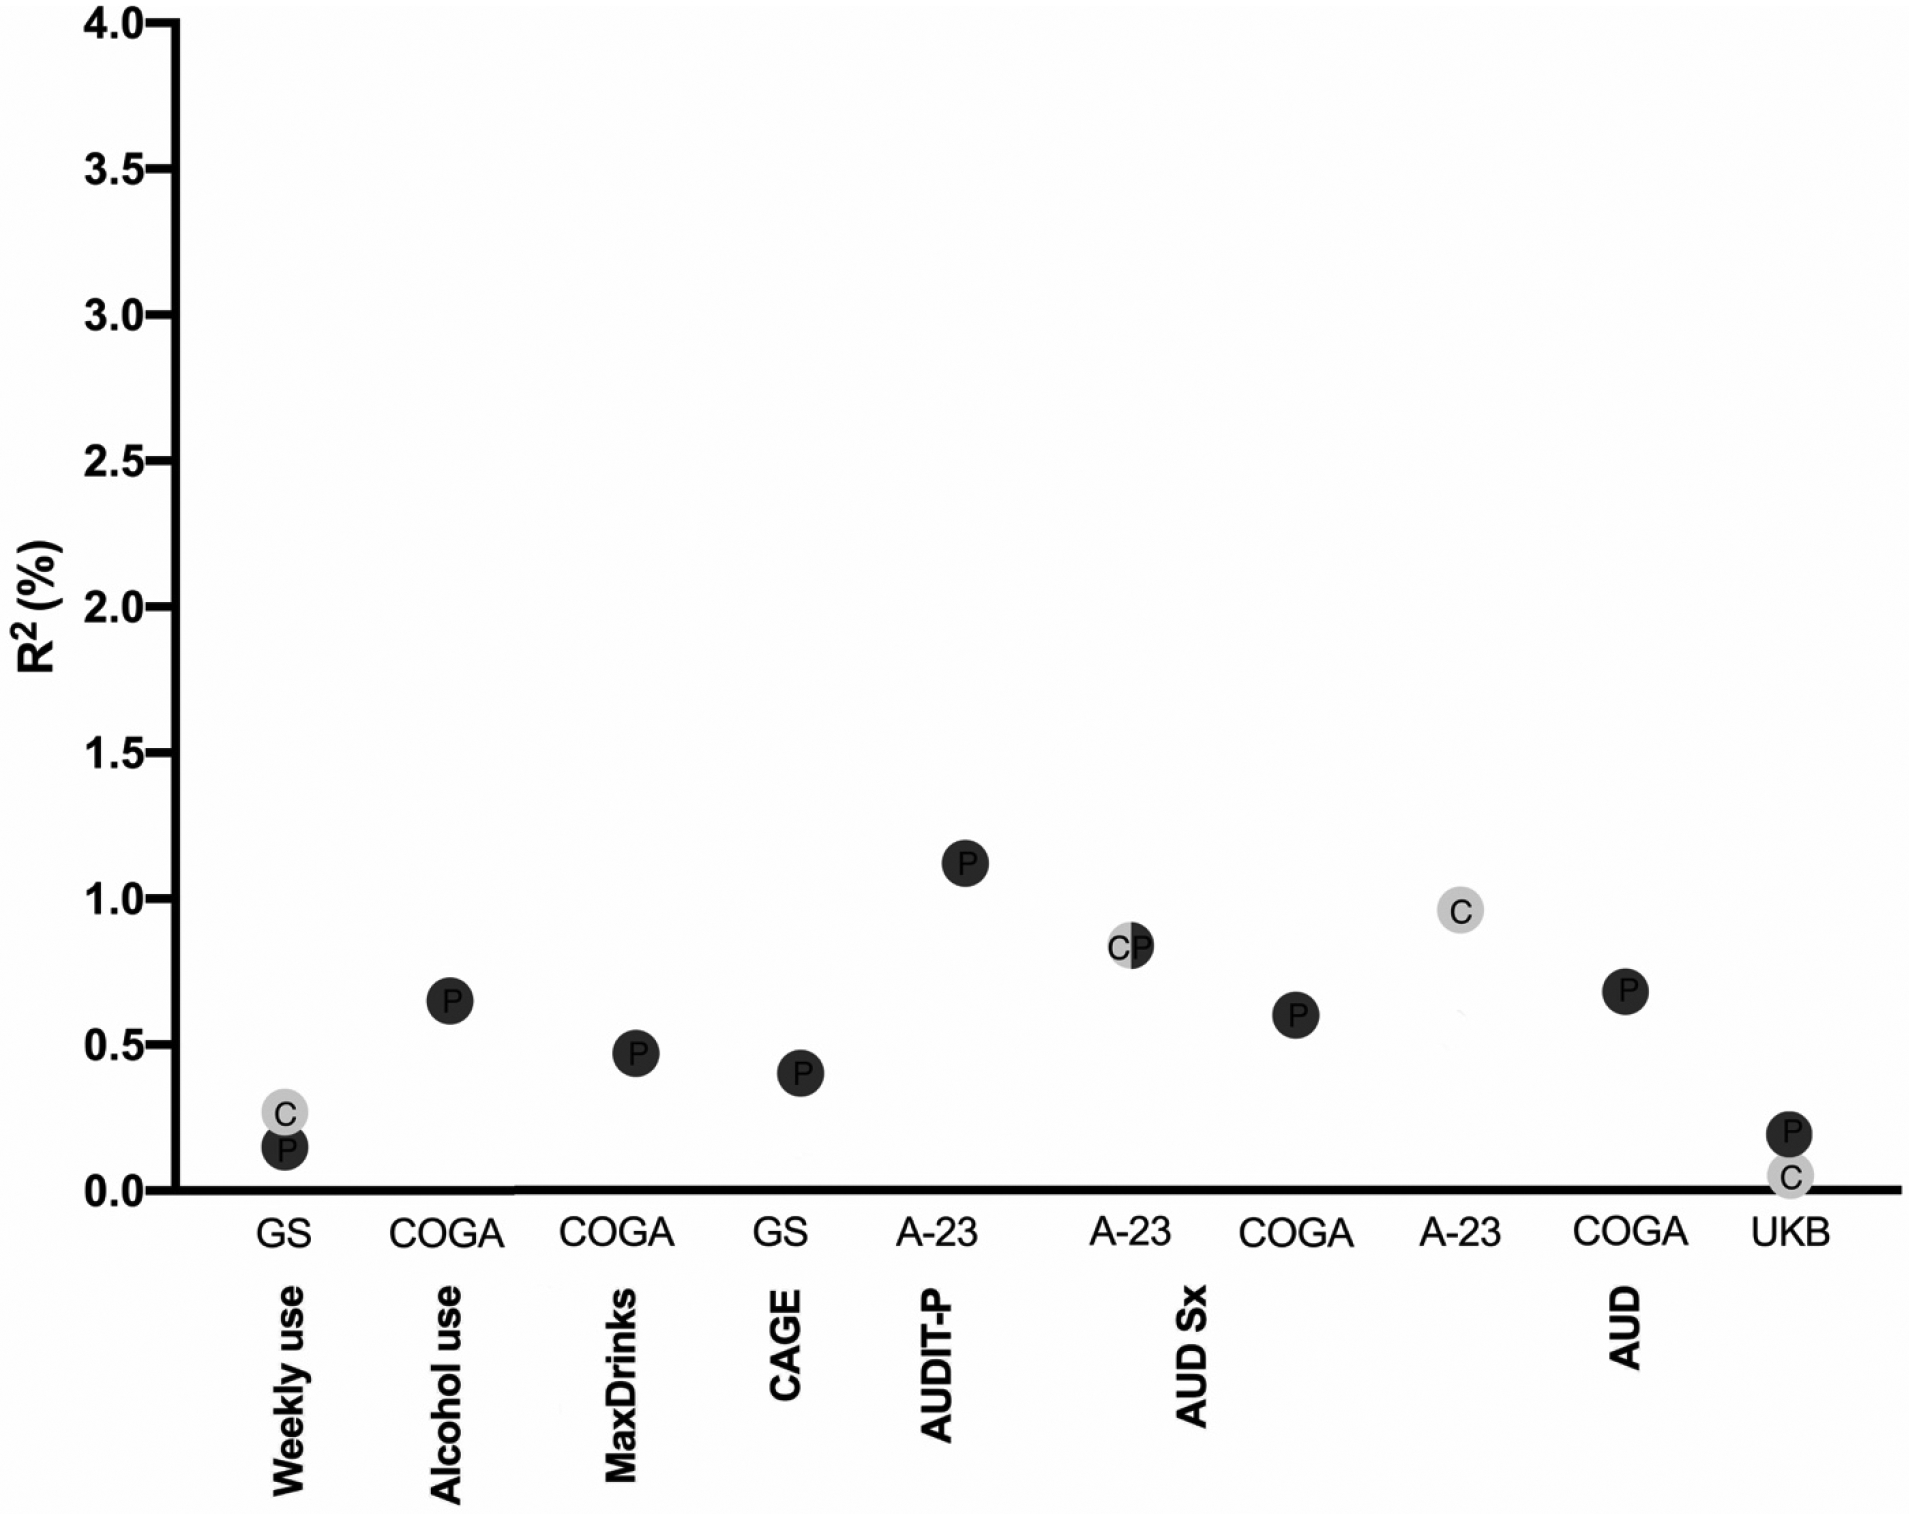
Figure 2. Overview of the magnitude of predicted variance (R2, %) across the alcohol-related phenotypes probed in the four independent samples (Generation Scotland, GS; ALSPAC at age 23, A23; Collaborative Study on the Genetics of Alcoholism, COGA; and UK Biobank, UKB).

The color of the dots denotes AUDIT-C (light gray) or AUDIT-P (dark gray) PRS. Only the significant (p < 0.0004) associations are shown. C, AUDIT-C; P, AUDIT-P.
