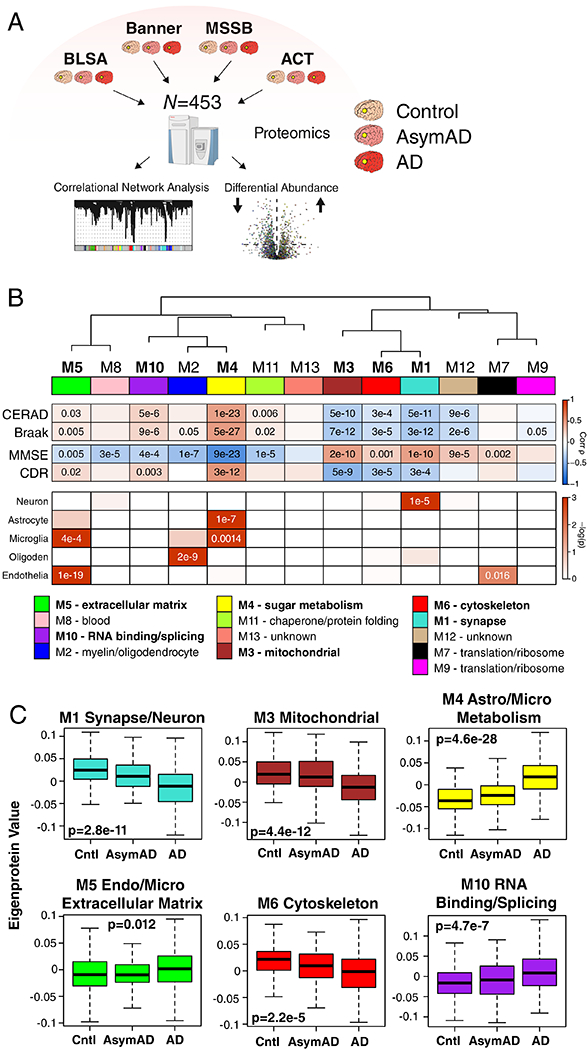
Figure 1. Protein Network Analysis of Asymptomatic and Symptomatic Alzheimer’s Disease Brain.

(A-C) Protein levels in brain tissue from control, asymptomatic Alzheimer’s disease (AsymAD), and Alzheimer’s disease (AD) patients (N=453) were measured by label-free mass spectrometry and analyzed by weighted correlation network analysis (WGCNA) and differential abundance (A). Brain tissue was analyzed from postmortem dorsolateral prefrontal cortex (DLPFC, highlighted in yellow) in the Baltimore Longitudinal Study of Aging (BLSA, n=11 control, n=13 AsymAD, n=20 AD, n=44 total), Banner Sun Health Research Institute Brain Bank (Banner, n=26 control, n=58 AsymAD, n=94 AD, n=178 total), Mount Sinai School of Medicine Brain Bank (MSSB, n=46 control, n=17 AsymAD, n=103 AD, n=166 total), and the Adult Changes in Thought Study (ACT, n=11 control, n=14 AsymAD, n=40 AD, n=65). (B) A protein correlation network consisting of 13 protein modules was generated from 3334 proteins measured across four separate cohorts. (Top) Module eigenproteins, which represent the first principle component of the protein expression within each module, were correlated with neuropathological hallmarks of Alzheimer’s disease (CERAD, Consortium to Establish a Registry for Alzheimer’s disease amyloid-β plaque score, higher scores represent greater plaque burden; Braak, tau neurofibrillary tangle staging score, higher scores represent greater extent of tangle burden), cognitive function (MMSE, mini-mental status examination score, higher scores represent better cognitive function), and overall functional status (CDR, clinical dementia rating score, higher scores represent worse functional status). CERAD and Braak measures were from all cohorts, while MMSE was from Banner and CDR was from MSSB. Strength of positive (red) or negative (blue) correlation is shown by two-color heatmap, with p values provided for all correlations with p < 0.05. Modules that showed a significant correlation with all four traits are highlighted in bold. (Middle) The cell type nature of each protein module was assessed by module protein overlap with known neuron, astrocyte, microglia, oligodendrocyte (oligoden), and endothelia cell markers. Significance of overlap is shown by one-color heatmap, with p values provided for overlaps with p < 0.05. (Bottom) Gene ontology (GO) analysis of the proteins within each module clearly identified, for most modules, the biological processes associated with the module. (C) Module eigenprotein level by case status for each protein module that had significant correlation to all four traits in (B). Case status is from all cohorts (control, n=91; AsymAD, n=98; AD, n=230 after network connectivity outlier removal). APOE genotype effects and other trait correlations for all modules are provided in Supplementary Figure 1. Module eigenprotein correlations were performed using biweight midcorrelation and corrected by the Benjamini-Hochberg method. Protein module cell type overlap was performed using one-sided Fisher’s exact test with Benjamini-Hochberg correction. Differences in eigenprotein values were assessed by Kruskal-Wallis one-way ANOVA. Boxplots represent the median, 25th, and 75th percentiles, and whiskers represent measurements to the 5th and 95th percentiles. Cntl, control; AsymAD, asymptomatic Alzheimer’s disease; AD, Alzheimer’s disease.
