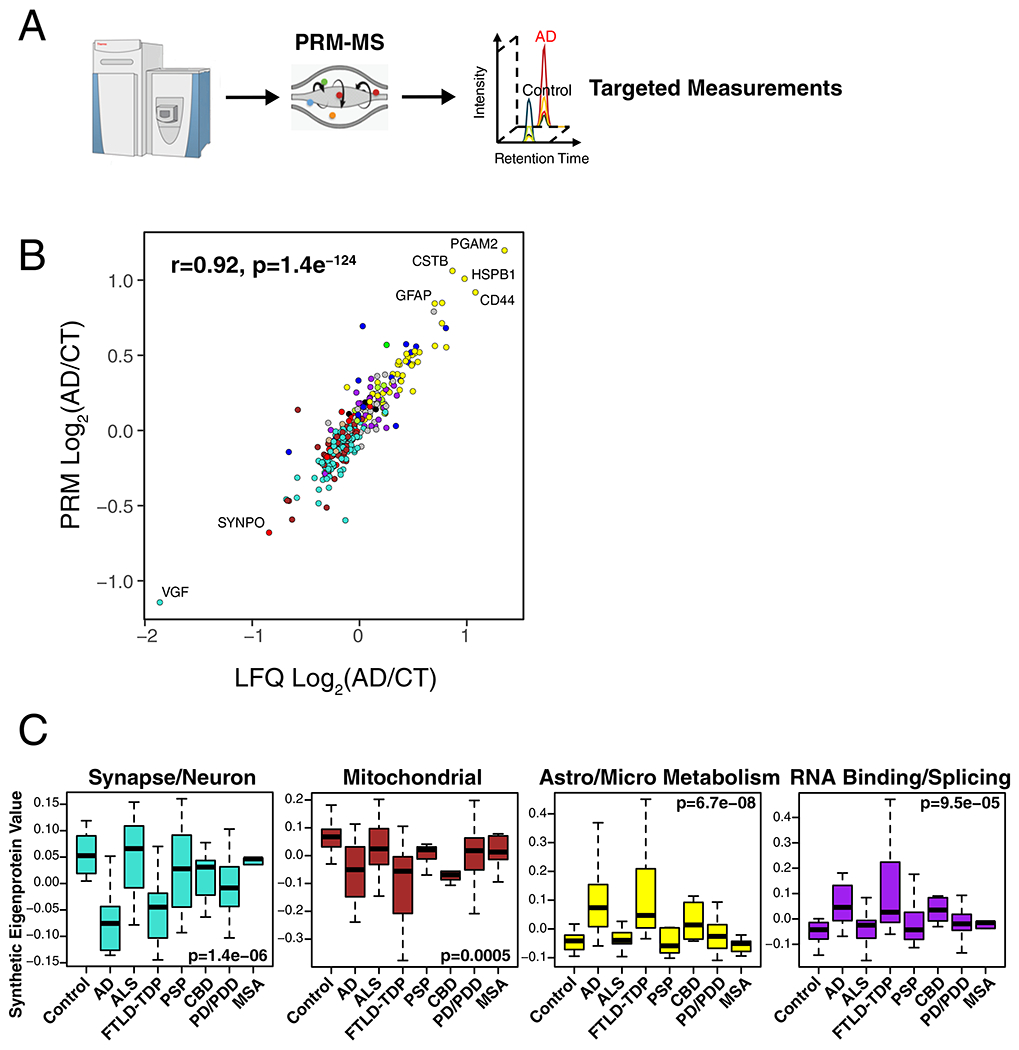
Extended Data Figure 6. AD Protein Network Module Changes in Other Neurodegenerative Diseases by PRM Analysis.

(A-C) Protein levels for 323 proteins across 108 brains from the UPenn cohort were measured by parallel reaction monitoring targeted mass spectrometry (PRM-MS) (A). Targeted peptides and individual protein measurements by disease group are provided in Supplementary Table 4 and Supplementary Figure 11, respectively. (B) Protein levels across all cases were highly correlated between LFQ and PRM measurements (n=307 paired protein measurements). Correlation was performed by Pearson’s rho and Student’s significance (p). (C) A synthetic eigenprotein was created from proteins that mapped to an AD network module and measured across the different disease groups (control case samples n=46, AD n=49, ALS n=59, FTLD-TDP n=29, PSP n=27, CBD n=17, PD/PDD n=80, and MSA n=23 after network connectivity outlier removal). Analyses for all modules are provided in Supplementary Figure 12. Differences in module synthetic eigenproteins were assessed by Kruskal-Wallis one-way ANOVA. Differences between AD and other case groups were assessed by two-sided Dunnett’s test, the results of which are provided in Supplementary Table 4. Boxplots represent the median, 25th, and 75th percentiles, and whiskers represent measurements to the 5th and 95th percentiles.
