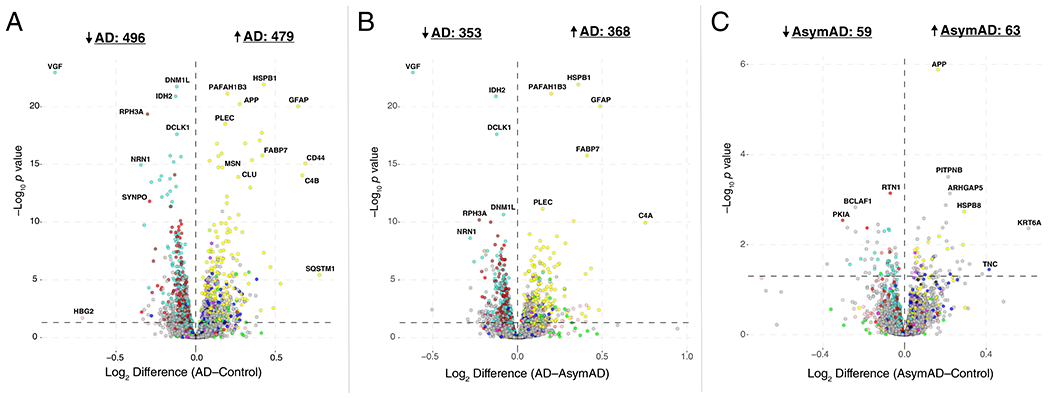
Extended Data Figure 7. Protein Differential Abundance in AD Brain.

(A-C) Differential protein abundance for AD versus control (A), AD versus AsymAD (B), and AsymAD versus control (C) brain, represented by fold-change versus t statistic for the given comparison (n=230 AD, n=98 AsymAD, n=91 control case samples after network connectivity outlier removal). Differential abundance data are from the consensus analysis described in Figure 1A. Proteins are colored by the module in which they reside according to the scheme shown in Figure 1B. For instance, proteins that reside in module M4 are colored yellow. Pairwise comparisons were performed using one-way ANOVA with Tukey test. The bold horizontal dashed line represents p < 0.05. AsymAD, asymptomatic Alzheimer’s disease; AD, Alzheimer’s disease.
