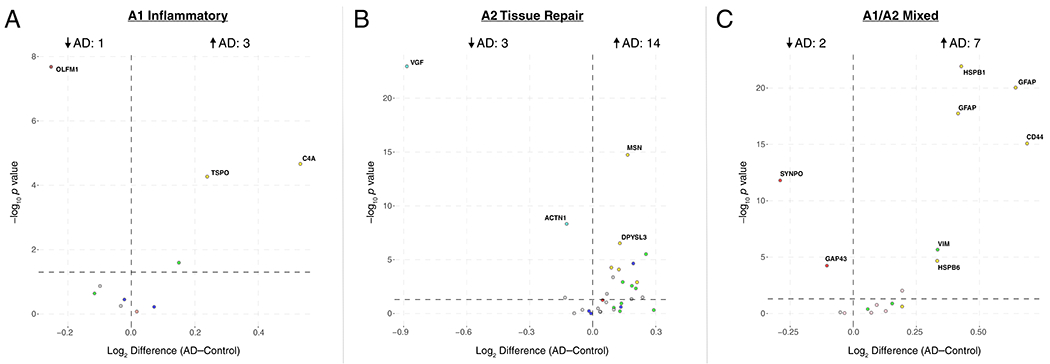
Extended Data Figure 8. Differential Abundance of Reactive Astrocyte Protein Markers in AD Brain.

(A-C) Proteins expressed in different astrocytic response states to acute injury26 were analyzed for changes in AD. Astrocyte mRNAs that were upregulated greater than four-fold after acute injury by LPS administration (“A1” Inflammatory) (A), middle cerebral artery occlusion (“A2” Tissue Repair) (B), or both (“A1/A2 Mixed”) (C) were analyzed for changes in abundance between AD and control. Results are shown as protein fold-change versus t statistic for the given comparison (n=230 AD, n=98 AsymAD, n=91 control case samples after network connectivity outlier removal). Pairwise comparisons were performed using one-way ANOVA with Tukey test. The bold horizontal dashed line represents p < 0.05. Proteins are colored by the module in which they reside according to the scheme shown in Figure 1B. AD, Alzheimer’s disease.
