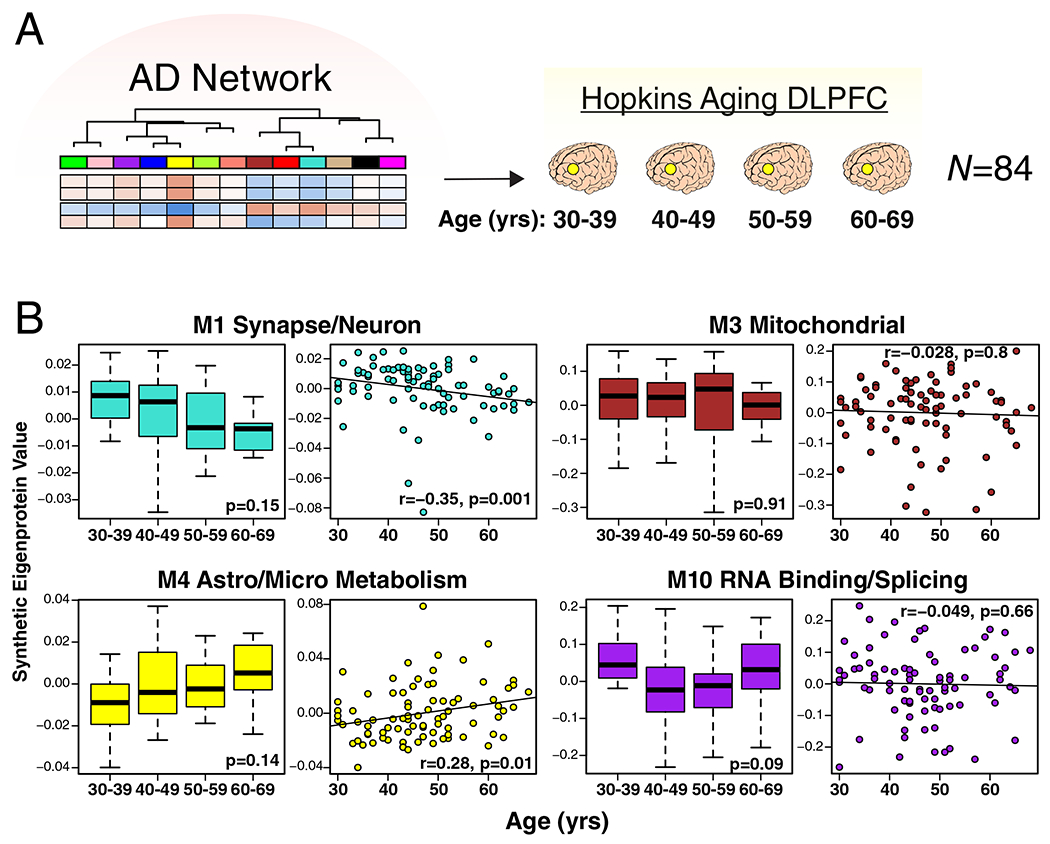
Figure 3. Effects of Aging on AD Protein Network Modules.

(A, B) Protein levels were measured in DLPFC from cognitively normal people who died at different ages (age 30–39, n=20; age 40–49, n=34; age 50–59, n=17; age 60–69, n=13), and used to analyze AD protein network module changes with age. Brains were obtained from Johns Hopkins University. (B) A synthetic eigenprotein was created for each AD network module as described in Extended Data Figure 5 and measured by age group (left boxplot) as well as correlated with age (right scatterplot) in the aging brain cohort. Synthetic eigenprotein analyses for modules M1, M3, M4, and M10 are shown. Analyses for all modules are provided in Supplementary Figure 9. Differences in module synthetic eigenproteins by age grouping were assessed by Kruskal-Wallis one-way ANOVA. Synthetic eigenprotein correlations were performed using biweight midcorrelation. Boxplots represent the median, 25th, and 75th percentiles, and whiskers represent measurements to the 5th and 95th percentiles.
