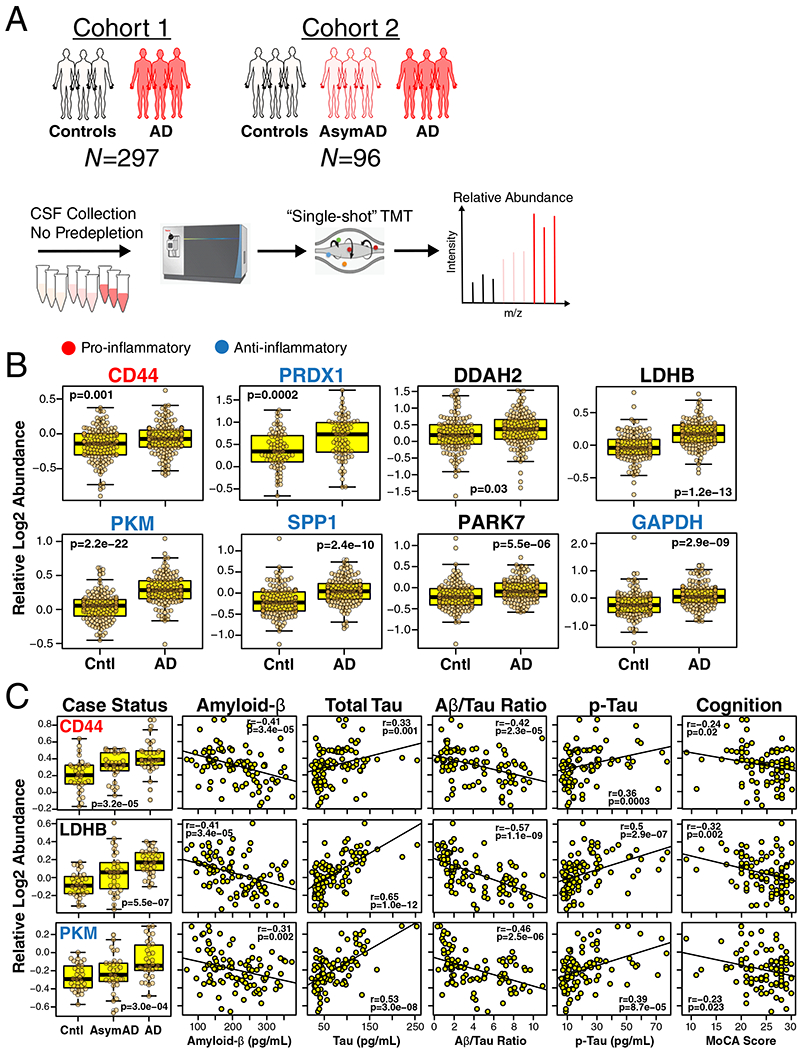
Figure 6. M4 Astrocyte/Microglial Metabolism Module Protein Levels Are Elevated in AsymAD and AD CSF.

(A-C) Approach to analysis of M4 proteins in CSF from two different cohorts (A). CSF in Cohort 1 (n=297 biologically independent case samples) was obtained from subjects with normal CSF amyloid-β and tau levels (controls, n=150 case samples) and patients with low amyloid-β, elevated tau levels, and cognitive impairment (AD, n=147 case samples). CSF in Cohort 2 (n=96 biologically independent case samples) was obtained from control subjects (n=32 case samples) and AD patients (n=33 case samples) as defined in Cohort 1, as well as subjects with CSF amyloid-β and tau levels that met criteria for AD but who were cognitively normal at the time of collection (AsymAD, n=31 case samples). CSF was analyzed without prior pre-fractionation or depletion of highly abundant proteins; relative protein levels were measured by TMT-MS. (B) Relative CSF protein levels of selected M4 module members in Cohort 1. Protein names are colored according to pro-inflammatory (red) or anti-inflammatory (blue) classification. Proteins that are considered neither pro- nor anti-inflammatory are in black. Additional M4 protein measurements, as well as trait correlations for the measured proteins, are provided in Supplementary Figure 13. (C) Relative CSF protein levels of selected M4 module members in Cohort 2. Protein names are colored as in (B). Additional measurements and trait correlations are provided in Supplementary Figure 14. Differences in protein levels were assessed by two-sided Welch’s t test (B) or Kruskal-Wallis one-way ANOVA (C). Correlations were performed using biweight midcorrelation. Boxplots represent the median, 25th, and 75th percentiles, and whiskers represent measurements to the 5th and 95th percentiles. Cntl, control; AsymAD, asymptomatic Alzheimer’s disease; AD, Alzheimer’s disease; TMT, tandem mass tag; MoCA, Montreal Cognitive Assessment (higher scores represent better cognitive function).
