
Extended Data Figure 2. Covariate Effects on AD Network Protein Quantitative Values and Modules.
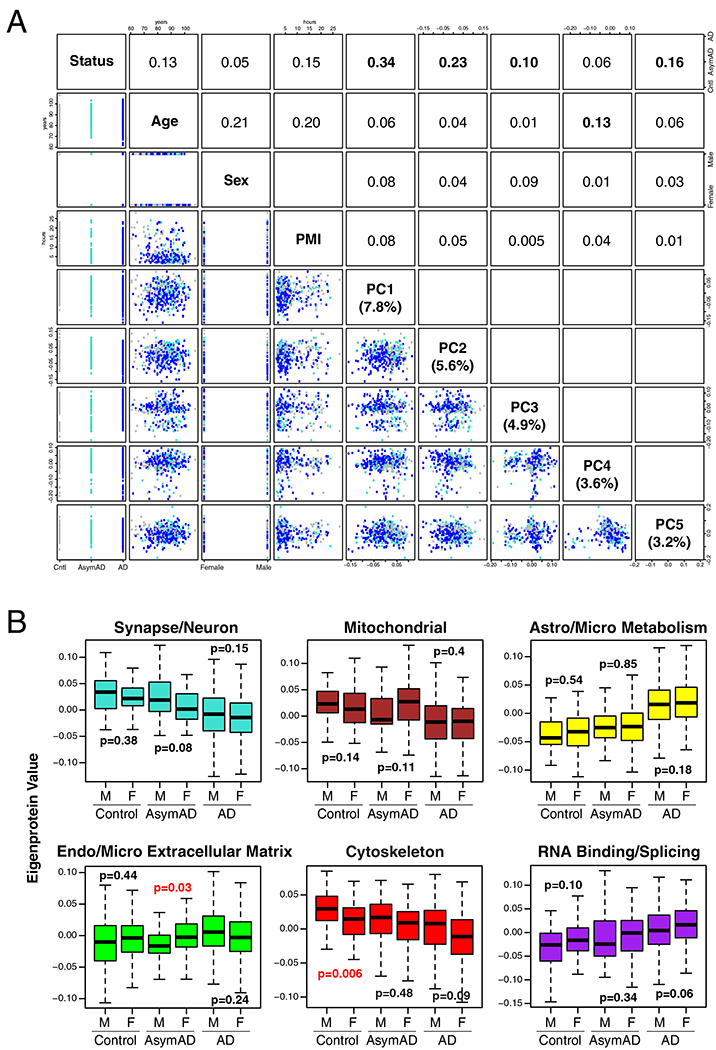
(A, B) Principal component analysis was performed on AD network protein quantitative values after batch correction but prior to regression for age, sex, and post-mortem interval (PMI) covariates (n=418 case samples after network connectivity outlier removal) (A). Correlation values between case status (control, AsymAD, or AD), age, sex, PMI, and the first five principal components of the data are shown. The covariate most strongly correlated to each principal component is highlighted in bold. The percentage of variance in the data explained by each principal component is given in parentheses. (B) Effects of sex on AD network modules shown in Figure 1C. The AD network was built without regression for sex, and module eigenprotein levels were compared between male and female sex for each case group (n=123 AD, 54 AsymAD, 44 control females; n=103 AD, 45 AsymAD, 49 control males). Statistically significant differences are highlighted in red. Correlations were performed using Spearman’s rank correlation. Differences in protein levels were assessed by Kruskal-Wallis one-way ANOVA. Boxplots represent the median, 25th, and 75th percentiles, and whiskers represent measurements to the 5th and 95th percentiles. PC, principal component; PMI, post-mortem interval; Cntl, control; AsymAD, asymptomatic Alzheimer’s disease; AD, Alzheimer’s disease.