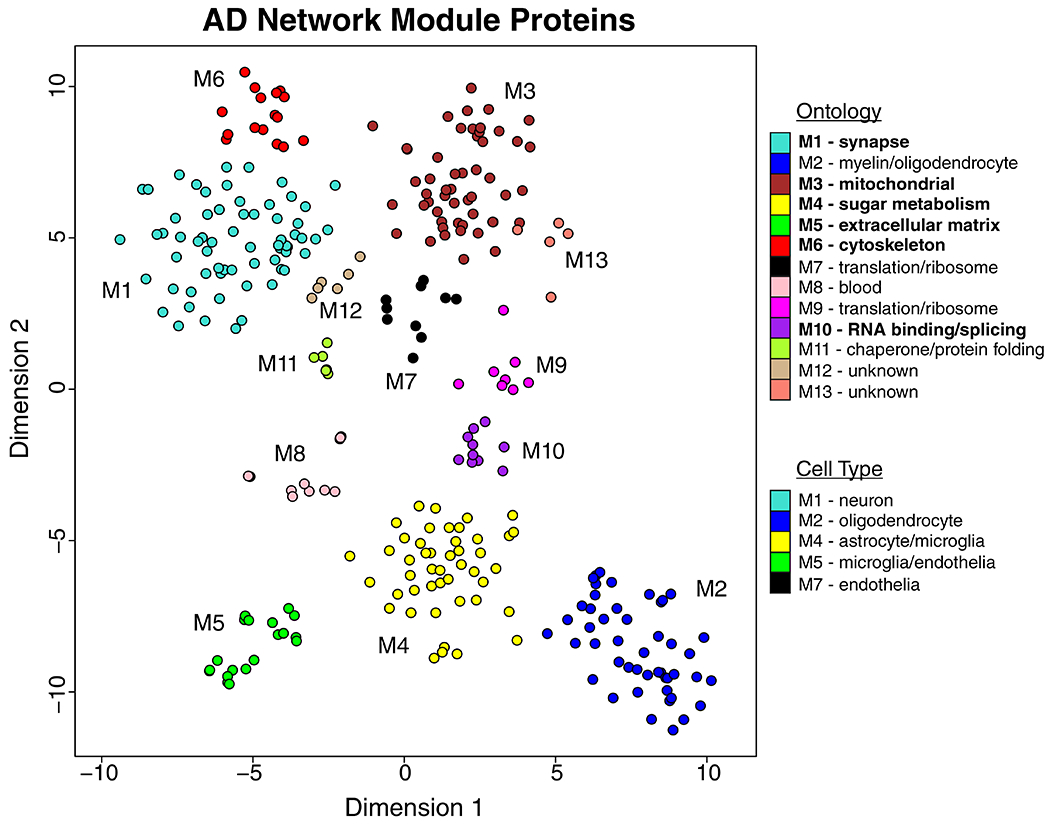
Extended Data Figure 3. Relationship of AD Network Proteins by t-SNE Analysis.

Dimensionality reduction and visualization by t-distributed stochastic neighbor embedding (t-SNE) was applied to proteins that were in the top 25% by kME value within each AD network module. Proteins are color coded as shown in Figure 1B according to the network module in which they reside. Network module ontologies and cell type enrichments are provided as shown in Figure 1B. Ontologies are highlighted based on the most robust AD trait correlations as shown in Figure 1B.
