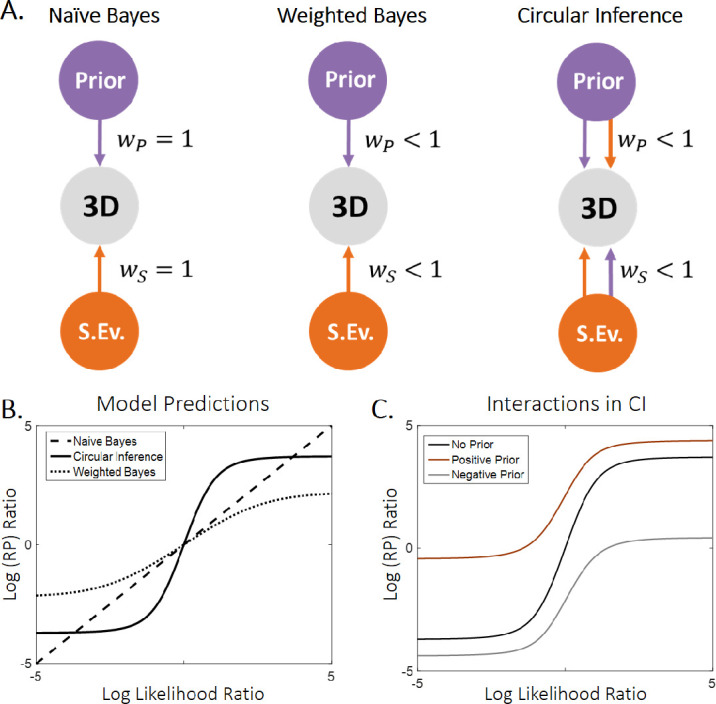
Figure 3.

Models and model predictions. (A) Three different models were used to fit the data. The simplest model (naïve Bayes [NB], left panel) consisted of a simple addition of the sensory evidence and prior on the log scale and is equivalent to a three-layer generative model in which all the connections are equal to 1. The weighted Bayes (WB) model (middle panel) further assumes that only partial trust exists between the nodes of the generative model. Importantly, both the NB and WB models do exact inference. Finally, we used a circular inference (CI) model (right panel) that further allows reverberation and overcounting of sensory evidence and prior knowledge. (B) The log(RP) ratio predicted by the models as a function of the log-likelihood ratio. The NB model predicts a linear dependence, whereas both the WB and CI models predict sigmoid curves (due to the saturation imposed by the weights). Furthermore, the three models generate different predictions about the slope of the curves around zero. The NB and WB models predict a slope of 1 and less than 1, respectively, and only the CI model predicts a slope greater than 1. (C) In the CI model, the slope of the log-likelihood/log-posterior curve also depends on the log-prior as a result of the reverberations, indicating an interaction between the two different types of information (Leptourgos et al., 2017). Weaker priors are associated with steeper sigmoid curves. The reason is the saturating effect of the weight when priors and sensory inputs are congruent (they are both positive/negative).
