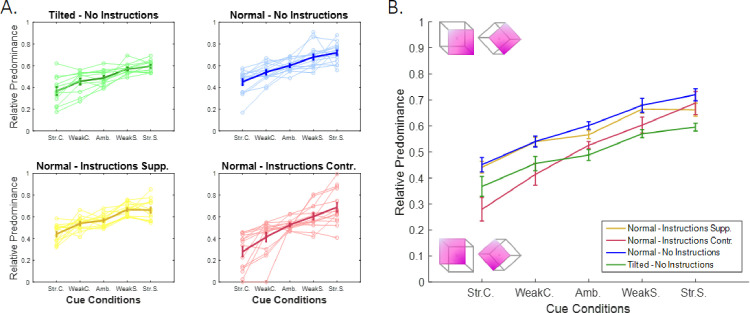
Figure 4.
Relative predominance between conditions. (A) The four subplots illustrate the four different prior conditions: tilted cube (top left plot, green; n = 12) or normal cube with no instructions (top right plot, blue; n = 15), supporting instructions (bottom left plot, yellow; n = 14) or contradictory instructions (bottom right plot, red; n = 14). The x-axis presents the five cue conditions, ranging from a strong cue supporting the SFB interpretation (left panels) to a strong cue supporting the SFA interpretation (right panels). Thin lines correspond to the behaviors of single participants (outliers are not presented), and thick lines represent the average RP for each group calculated after removing the outliers (± SE). (B) Between-groups comparison of average RP values. A linear mixed-effects model revealed significant effects of sensory evidence (p < 0.001) and the prior (contradictory instructions, p < 0.001) and tilt (p < 0.001) manipulations. We also observed a cue x instruction interaction for the contradictory instructions (red curve) compared with supporting instructions (yellow curve, p = 0.016) and the tilted cube (green curve, p = 0.021).

