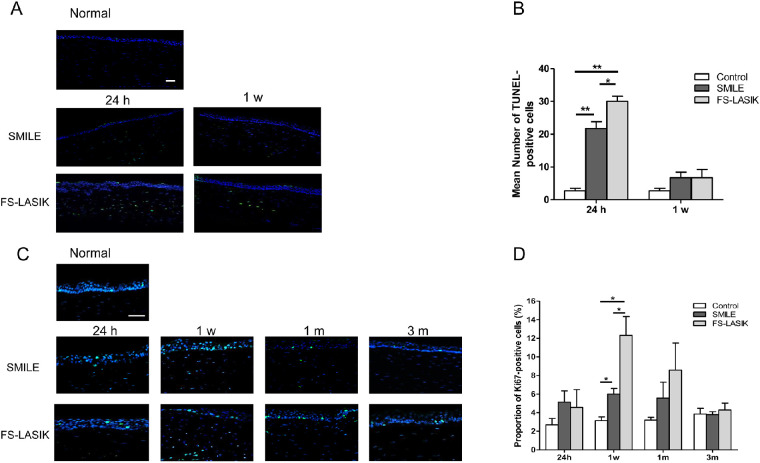
Figure 4.
Apoptosis and cell proliferation at different time points in the corneas underwent SMILE and FS-LASIK. (A) Representative images of TUNEL assay to assess the level of apoptosis in the cornea for all groups postoperatively (blue: DAPI; green: TUNEL-positive cells). Scale bar: 100 μm. (B) Bar chart showing the mean number of TUNEL-positive cells in the cornea at 24 hours and 1 week after both surgeries. (C) Expression for Ki67 immunofluorescence staining to detect the level of proliferation in the cornea of all groups postoperatively (blue: DAPI; green: Ki67-positive cells). Scale bar: 100 μm. (D) Bar chart showing the percentage of Ki67-positive cells in the cornea at all follow-up time points postoperatively. *P < 0.05. **P < 0.01.

