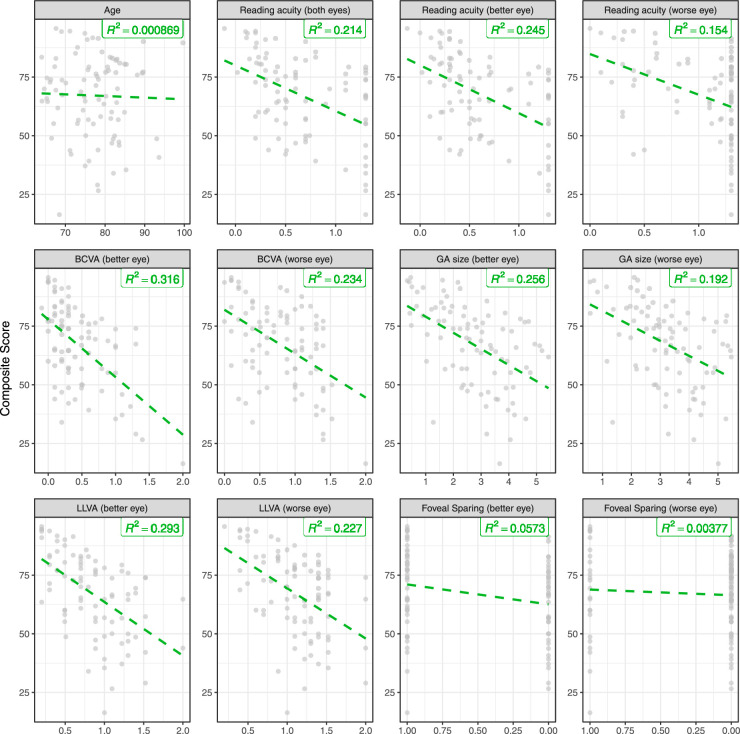
Figure 2.
Cross-sectional determinates of vision-related quality of life. All plots show VRQoL composite scores on the y-axis and the corresponding determinants on the x-axis. The dashed green lines show the univariable linear regression lines. The shown R2 estimates were obtained from models fit to the complete data (cross-validated R2 estimates are provided in Table 2).

