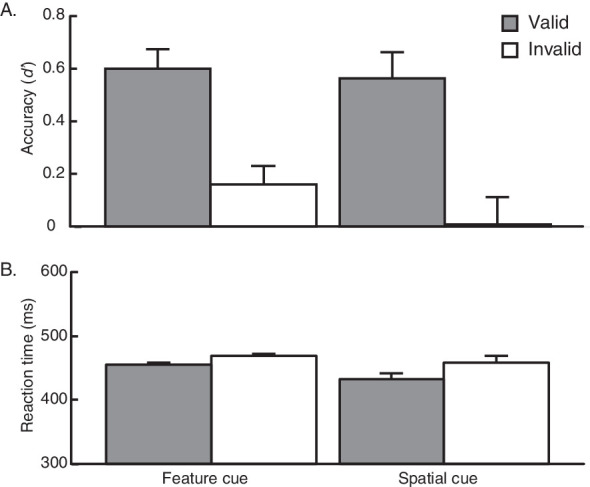
Figure 2.

Results from Experiment 1, where participants were either presented with a feature cue (FC group) or a spatial cue (SC group). Performance accuracy (A) and reaction time (B) on valid and invalid trials are plotted for each of the two groups. Mean reaction times (RTs) were calculated for correct trials only. Error bars reflect ±1 within-participant SEM.
