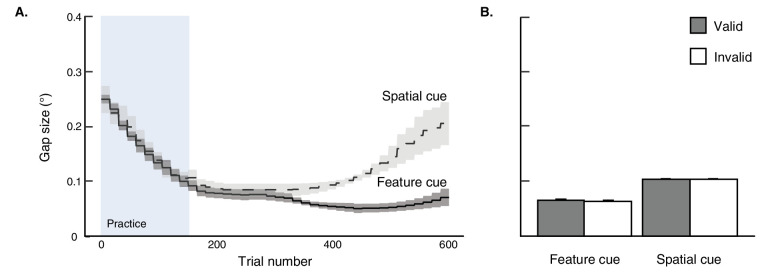
Figure 3.
Target gap size (in degrees) from Experiment 1 are plotted for the FC and SC groups, respectively, on a trial-by-trial basis (A) and averaged over valid and invalid trials for each group outside of the practice block (B). Error bars reflect ±1 within-participant SEM.

