Figure 6.
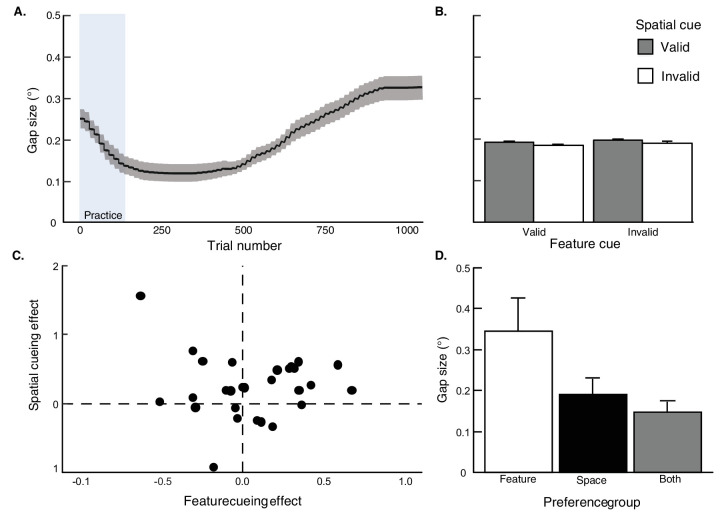
Target gap sizes (in degrees) from Experiment 2, depicted on a trial-by-trial basis (A) and averaged over valid and invalid trials for both the feature and spatial cues outside of the practice block (B). Participants were assigned to cue preference groups based on their cueing effects in accuracy (d′). Participants’ accuracy scores are plotted in a four-quadrant space (C), where the feature cueing effect is defined as feature-valid–invalid performance, and the spatial cueing effect is defined as space-valid–invalid performance. Each dot is a single participant. Participants with a positive feature cueing effect (only) were assigned to the feature preference group (n = 3); those with a positive spatial cueing effect (only) were assigned to the space preference group (n = 11); those with both positive feature and space cueing effects were assigned to the both preference group (n = 12). The target gap size (D) is plotted for each preference group. Error bars reflect ±1 within-participant SEM.

