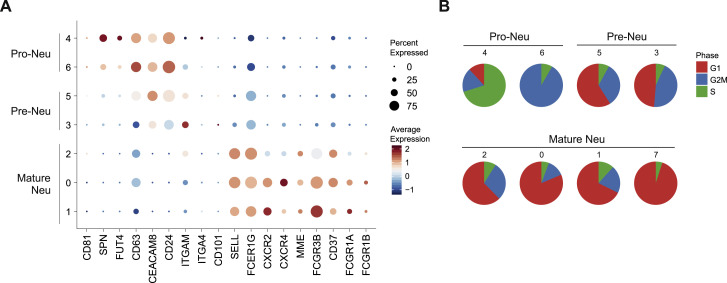
Figure S4.
Additional Analysis of Dysfunctional Neutrophils in PBMC Fraction, Related to Figure 5
A, Dot plot of marker genes associated with immature neutrophils (pro- and pre-neutrophils), and mature neutrophils.
B, Pie charts showing the proportion of cells predicted to be in a given cell cycle stage. The numbers refer to the cell clusters presented in panel A.

