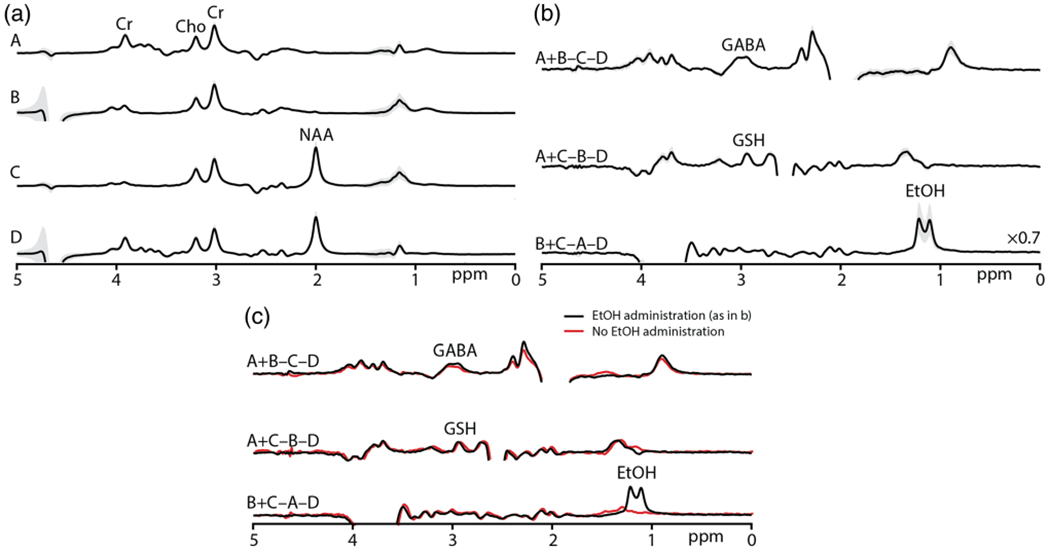
FIGURE 4.

a, average in vivo experiments A, B, C, D and edited spectra from six subjects showing the ±1 SD variability (in gray). b, in vivo experiments yielded the GABA-edited spectra from the Hadamard combination of experiments A + B − C − D, GSH-edited spectra from A + C − B − D, and EtOH-edited spectra from B + C − A − D. c, mean in vivo edited spectra from six subjects are overlaid with the mean HERMES-edited spectra from three subjects who had not consumed alcohol
