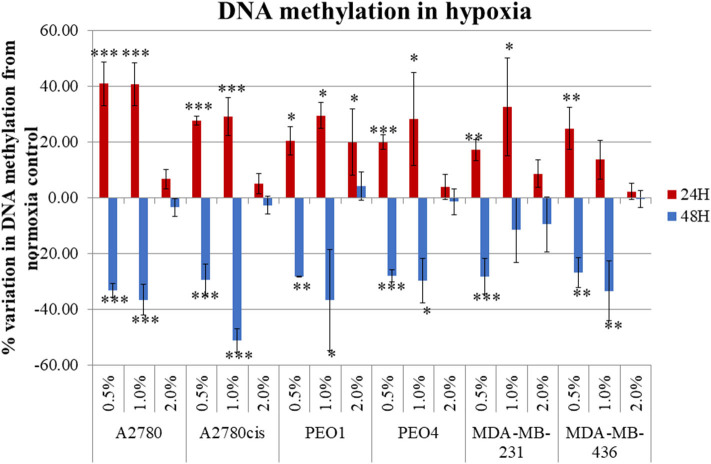
Figure 1.
Hypoxia alters global DNA methylation. The histogram represents the average global DNA methylation variation compared to a normoxic control for the 6 cell lines analyzed. Each cell line was exposed to 0.5, 1.0, and 2.0% for 24 h (blue) and 48 h (red). The error bars were calculated from the SD of 3 biological replicates. Significant changes are starred: * P ≤ 0.05; **P ≤ 0.01; ***P ≤ 0.001 (one-way ANOVA).

