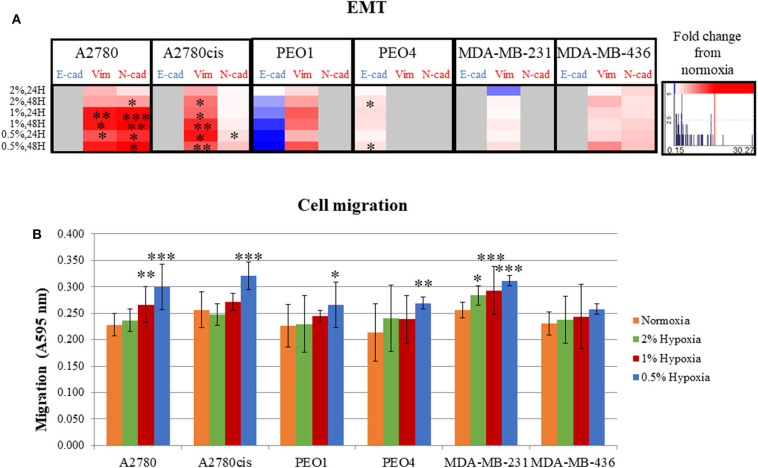
Figure 3.
Hypoxic exposure increases migration of breast and ovarian cancer cells; association with markers of EMT. (A) Fold change of the protein expression of E-cadherin, vimentin and N-cadherin as determined by densitometry (Image J)(Western blots are shown in Figure S3). Each condition was carried out on three biological replicates (n = 3). (B) Quantification of absorbance readings from the Oris migration assay following hypoxic exposure. Cells were stained with Coomassie Instant Blue and the absorbance was read at 595 nm. Error bars were calculated from 3 to 6 independent experiments with 4 technical replicates per experiment. Significant changes are starred: *P ≤ 0.05; **P ≤ 0.01; ***P ≤ 0.001 (T-test and ANOVA). The histograms on the right side of the figure are indicating increasing (in red) and decreasing (in blue) trends in EMT markers in hypoxia conditions comparing to normoxia.

