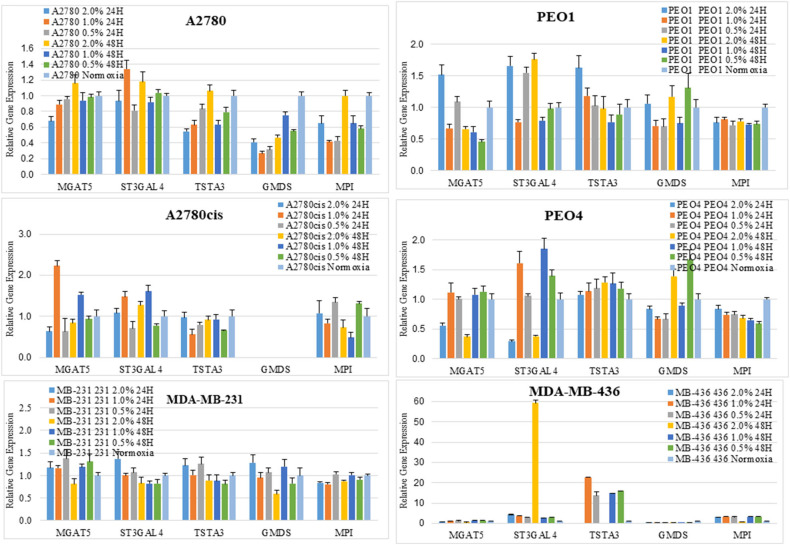
Figure 5.
Changes seen in UPLC N-glycan profiles, are associated with the mRNA expression levels of glycosyltransferases. Quantitative RT-PCR gene expression analyses were undertaken for selected glycosyltransferases (MGAT5 and ST3GAL4) and enzymes involved in the sugar nucleotide donor pathway (MPI, TSTA3, and GMDS) following the culturing of cells in differential hypoxic conditions (0.5–2% O2) compared to normoxia (21% O2) controls. The relative expression level of each gene was calculated according to the ddCt normalized with TATA-Box Binding Protein (TBP). Each condition was undertaken on one biological replicate (n = 1) and three technical replicates (n = 3).

