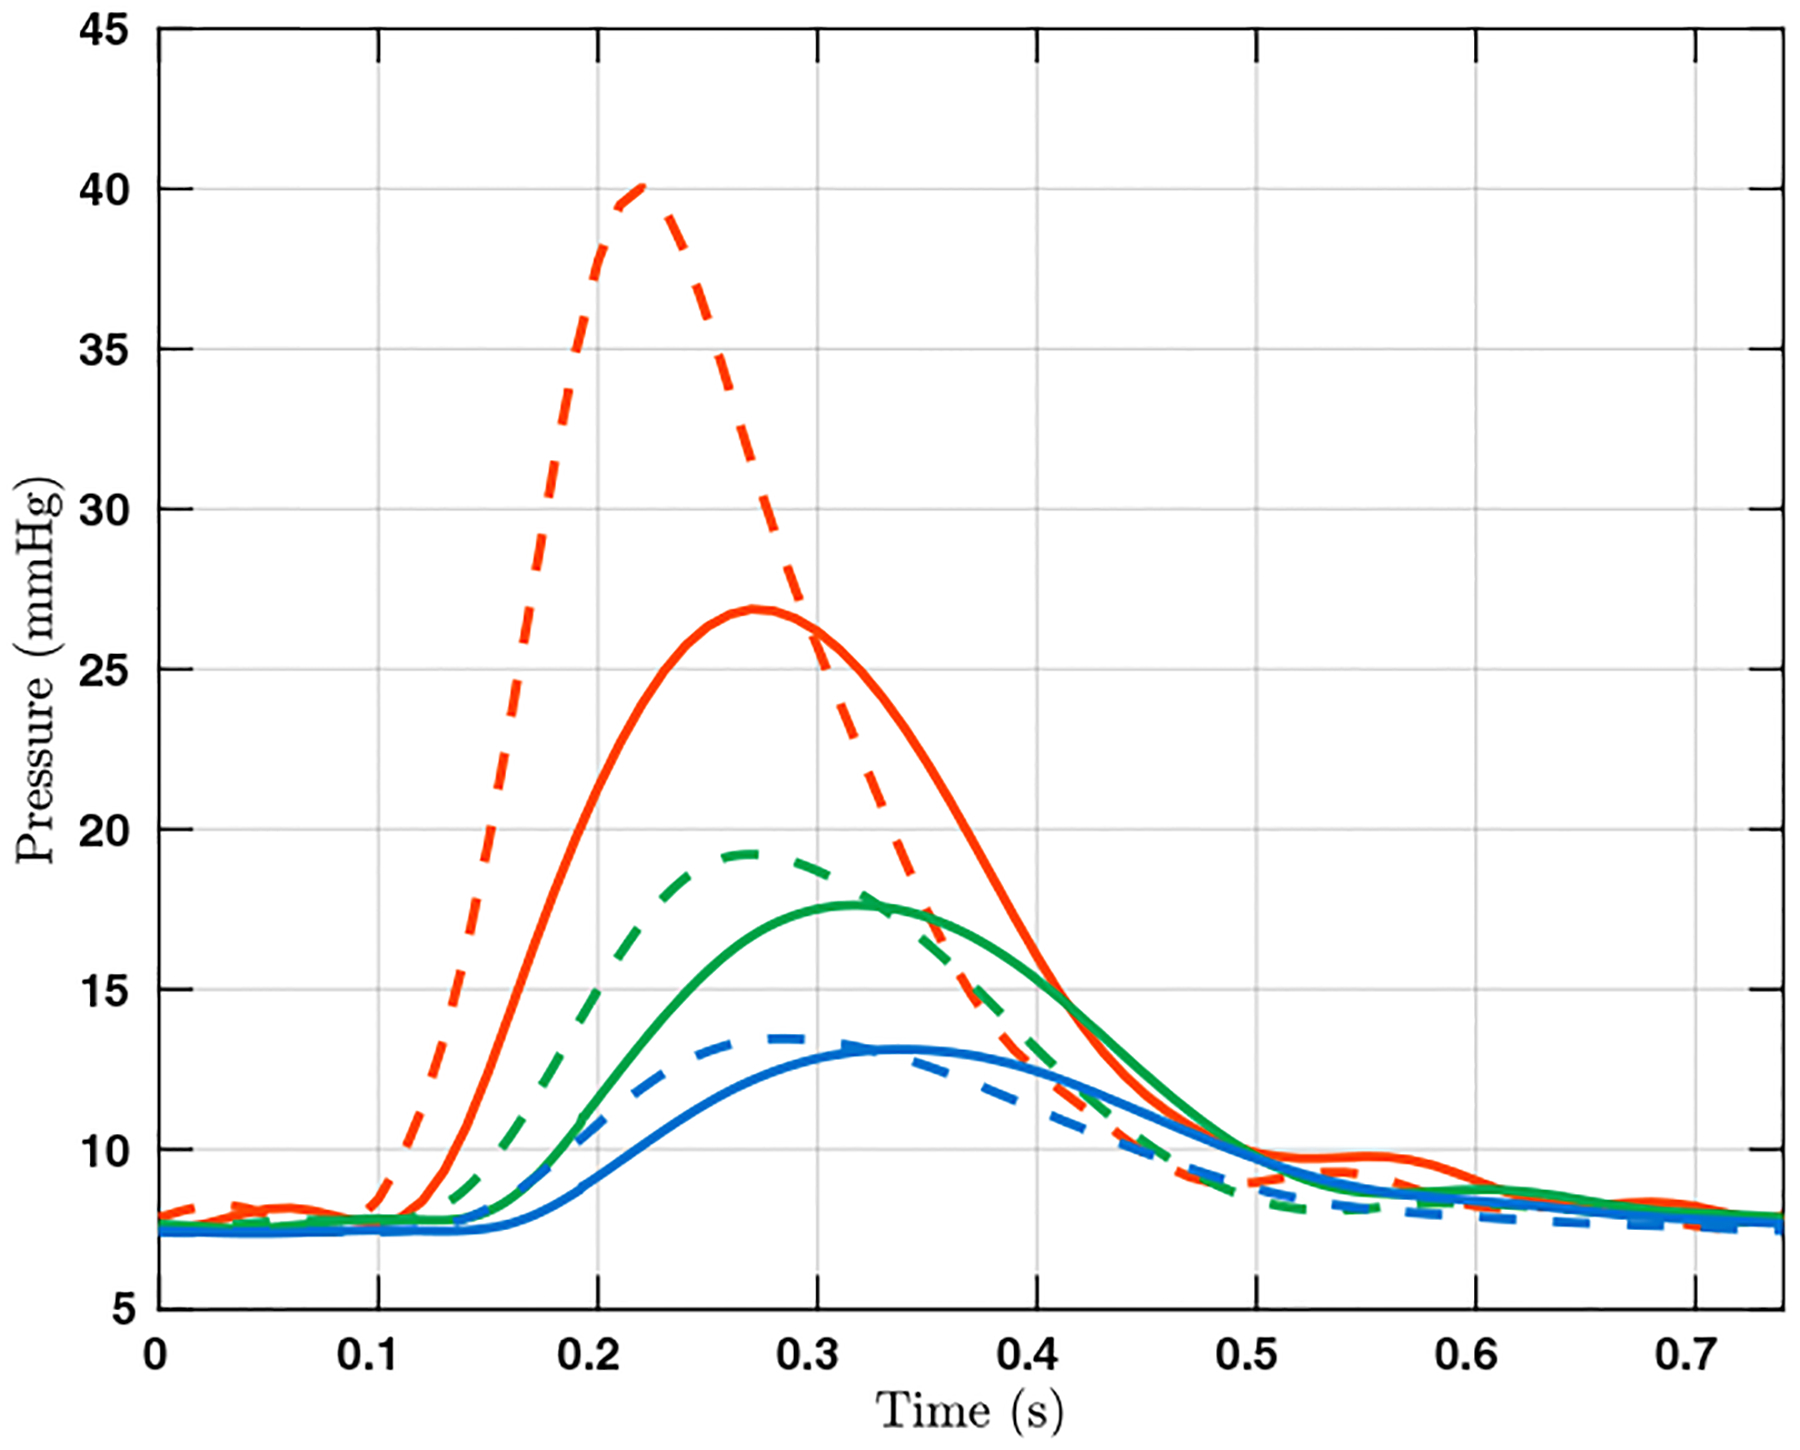
Figure 3:

The pressure over time in one cardiac cycle on the surfaces A (red), B (green), and C (blue). Results from the FSI and rigid wall simulations are plotted in solid and dashed lines, respectively. The locations of the three surfaces are indicated in Figure 1.
