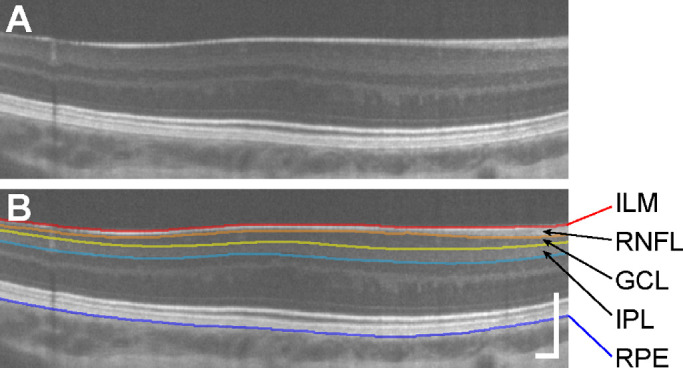
Figure 1.

The GCL and IPL can be clearly delimited in processed OCT scans. An example processed image from a participant with albinism, JC_11430 (A), is shown with segmentation contours (B) for the ILM (red), RNFL/GCL boundary (orange), GCL/IPL boundary (yellow), IPL/INL boundary (light blue), and RPE (dark blue). Scale bars = 200 µm.
