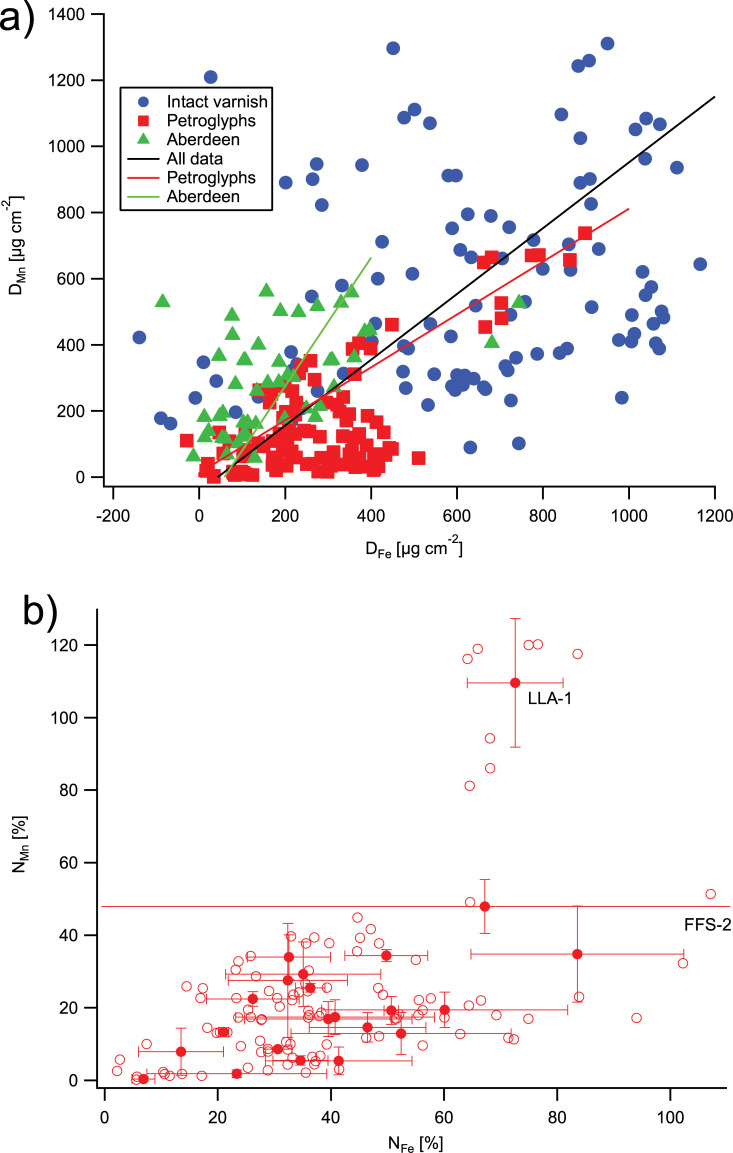
Fig 2. Areal density of Mn vs. areal density of Fe on the rock varnishes in the Owens/Rose Valley study area.
(a) Areal density of Mn (DMn) vs. areal density of Fe (DFe), (b) normalized areal densities, NMn vs. NFe, on the petroglyphs. The lines represent linear regressions; the regression parameters can be found in Table 3. Negative DFe values are a consequence of the relatively large uncertainty resulting from the subtraction of the host rock Fe contribution from the Fe signal.

