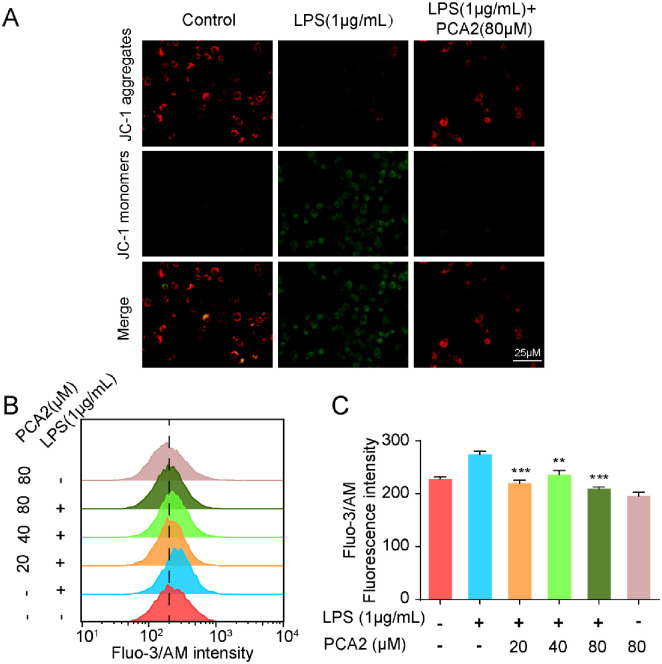
Fig 4. PCA2 reversed LPS-induced mitochondrial-membrane-potential (MMP) loss and calcium influx.
(A) The cell was exposed to PCA2 (80 μM) for 1 h and cultured with LPS for 8 h, except for the control group. For the measurement of MMP, JC-1 (10 μg/mL) was loaded for 0.5 h and images were acquired with a fluorescence microscope (n = 3). (B) Cells were co-cultured with LPS for 6 h before treated with PCA2 (20, 40, 80 μM) for 1 h, except the control group and only treated with PCA2 group. After cells were incubated with Fluo-3/AM (1 μM) for 1 h, collected to flow tube and monitored by the flow cytometry (n = 3). (C) Statistical analysis of the fluorescence intensity of Fluo-3/AM (n = 3).**p < 0.01, *** p < 0.001 vs. LPS group.

