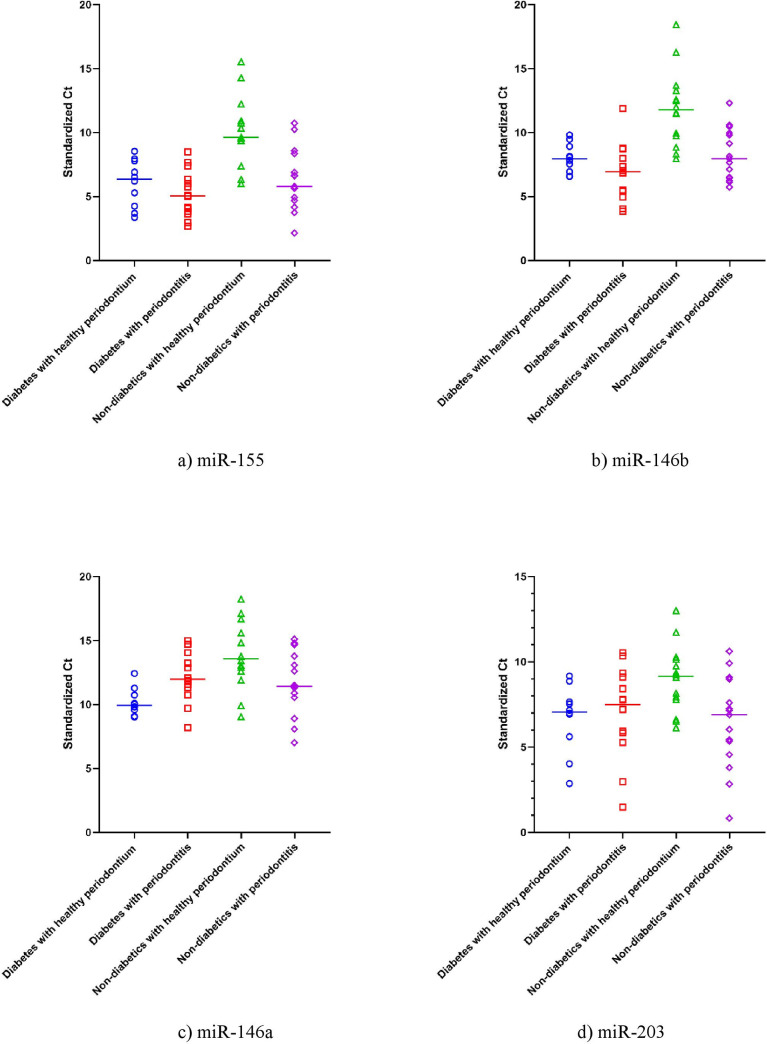
Fig 3.
The expression of miRNA a) miR-155, b) miR-146b, c) miR-146a and d) miR-203 in the study groups. Data shown is the standardized Ct for each miR in each participant of the study (n = 53). The horizontal line represents the mean Ct value for each group. Ct is inversely proportional to the gene expression; thus, the lower the CT value, the higher the expression level.

