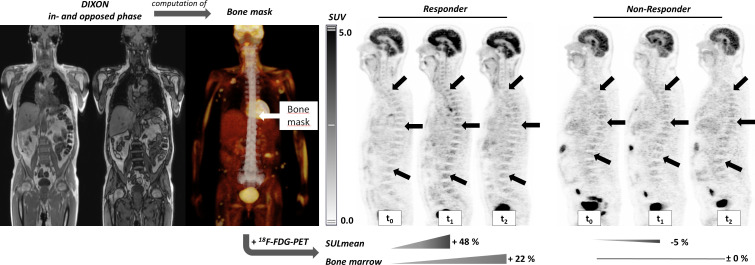
Figure 2.
Left hand side: DIXON MRI (in and opposed phase) were used to compute a bone mask of the spine (highlighted in the positron emission tomography (PET) maximum intensity projection image), which was copied to the PET images to assess the standardized uptake value lean body mass (SULmean) of the bone marrow. Right hand side: example of a responder (patient no. 10, also shown in online supplementary figure S2) and a non-responder (patient no. 11) to checkpoint inhibitor therapy. Note the changes of [18F]-labeled fluorodeoxyglucose (18F-FDG)-uptake in the bone marrow in the responder especially at t1 while there was no significant change observed in the non-responder.

