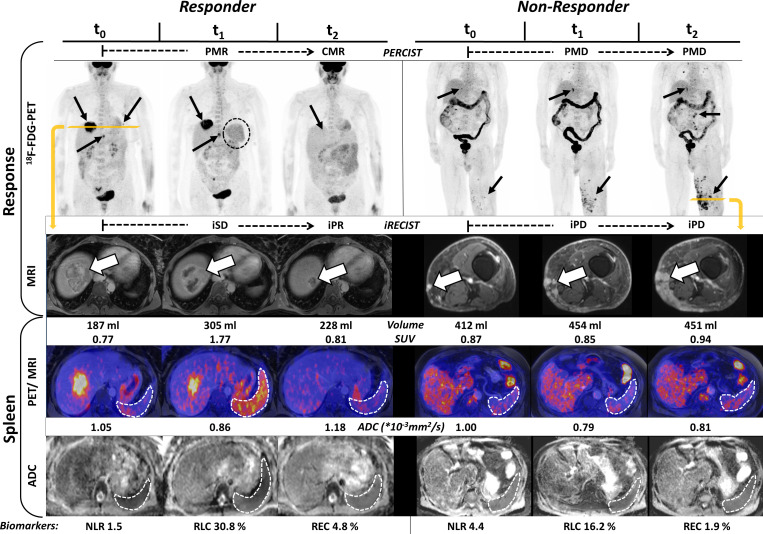
Figure 3.
Morphological (iRECIST) and metabolic (positron emission tomography (PET) response criteria in solid tumors (PERCIST)) response assessment (upper two rows, ‘Response’) as well as multiparametric changes in the spleen (‘Spleen’) and baseline immune biomarkers (bottom line) in a responder (left hand side, patient no. 14) and a non-responder (right hand side, patient no. 11) to checkpoint inhibitor therapy. Left hand side: metastases in the liver and the lung at t0 (black arrows) with an excellent treatment response already visible at t1 in PET: the metastases in the lung disappears in PET and the metabolic activity of the liver metastases decreases significantly, resulting in partial metabolic response (PMR); diameters of metastases did not show significant changes, leading to immune stable disease (iSD) in iRECIST at t1. Avital tumor residue in the liver at t2 (immune partial response (iPR)) without specific tracer uptake (complete metabolic response (CMR)). Note the significant increase of metabolic activity and the volume of the spleen (dotted ring in the PET/MRI), especially at t1 as compared with t0, considerably less pronounced at t2. Right hand side: metastases in the liver, the lung and the soft tissue of the left leg (black arrows). New metastases are visible in both MRI and PET already at t1, resulting in PMD/immune progressive disease (iPD). The volume of the spleen slightly increases under therapy, but the metabolic activity remains stable. The apparent diffusion coefficient (ADC)mean of the spleen did not show clear trends under therapy. The dotted regions of interes (ROIs) in the images aim to highlight the spleen and are not the volume of interest (VOI) used for image evaluation.

