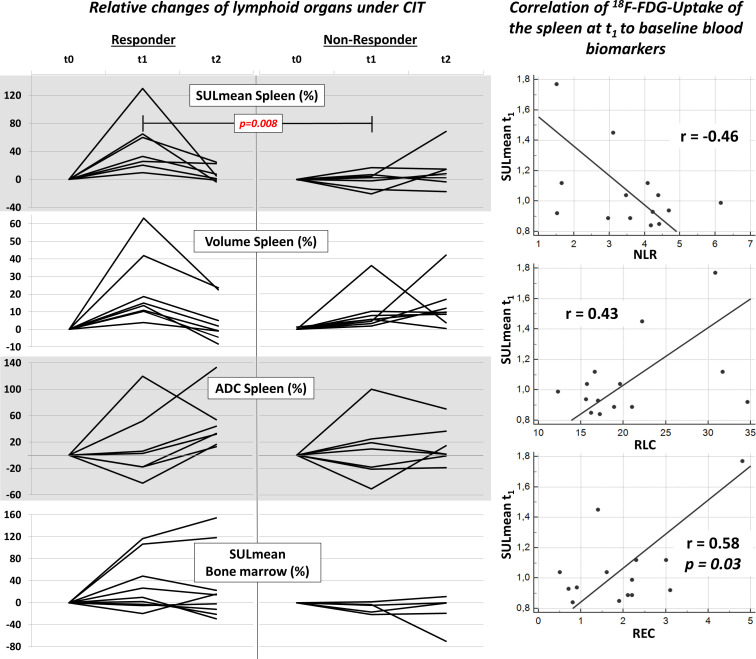
Figure 4.
Left hand side: results of the evaluation of lymphoid organs demonstrated as relative changes in % to the baseline scan t0 in the responder and non-responder group. Significant differences between the time points were found for SULmean at t1 and for relative differences between t0 and t1. Right hand side: correlation of metabolic activity of the spleen at t1 (SULmean t1) to the baseline immune biomarkers NLR, RLC and REC of all patients. NLR, neutrophile-lymphocyte ratio; REC, relative eosinophil count; RLC, relative lymphocyte count; SULmean, standardized uptake value lean body mass.

