Figure 3.
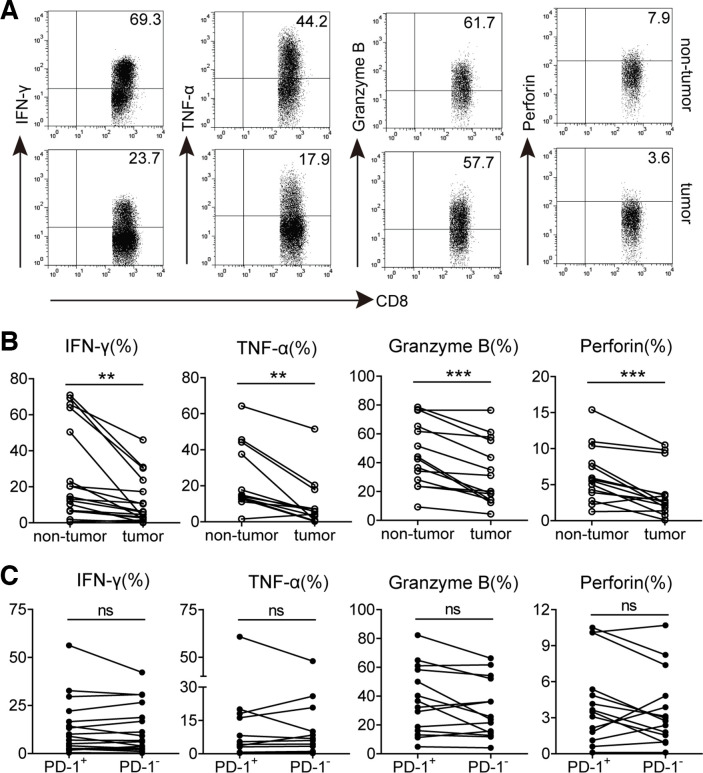
Functional characteristics of GC-infiltrating CD8+ T cells and PD-1+CD8+ T cells. (A) A representative flow cytometry analysis of IFN-γ, TNF-α, granzyme B and perforin expression in CD3+CD8+ T cells from paired non-tumor and tumor tissues of the same patient.(B) Statistical analysis of IFN-γ+, TNF-α+, granzyme B+ and perforin+ cell percentages in CD3+CD8+ T cells from non-tumor and tumor tissues of GC patients. (C) Statistical analysis of IFN-γ+, TNF-α+, granzyme B+ and perforin+ cell percentages in PD-1+ and PD-1− subsets of CD3+CD8+ T lymphocytes in tumors of GC patients. Symbols represent individual values from 12 to 17 GC patients analyzed individually. **p<0.01; ns, not significant: Student’s t test. GC, gastric cancer; PD-1, programmed cell death protein 1.

