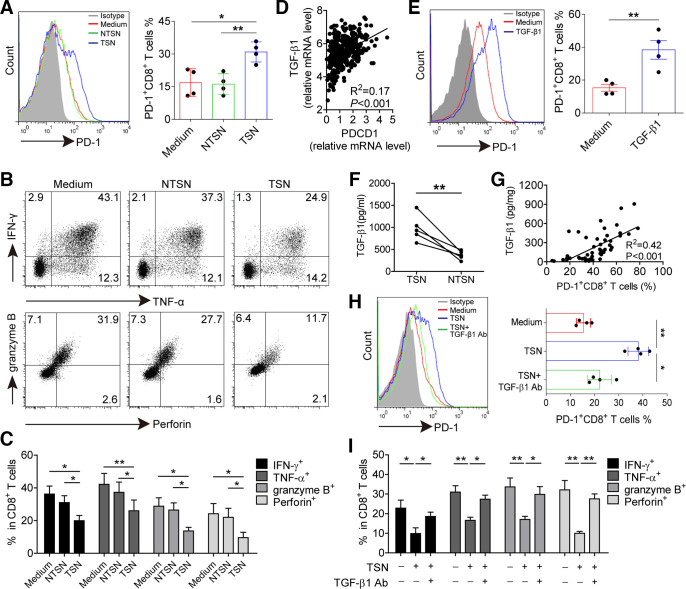
Figure 4.
GC-derived TGF-β1 contributes to PD-1 expression and dysfunction of CD8+ T cells. (A) CD8+ T cells were purified from PBMCs and exposed to 30% (v/v) TSN or NTSN for 72 hours in the presence of anti-CD3 and anti-CD28 antibodies; then the percentages of PD-1 expression on CD8+ T cells were analyzed (n=4). (B) Representative dot-plots of IFN-γ, TNF-α, granzyme B and perforin expression in CD8+ T cells treated with NTSN or TSN for 72 hours. (C) Statistical analysis of IFN-γ+, TNF-α+, granzyme B+ and perforin+ cell percentages in NTSN-treated and TSN-treated CD8+ T cells (n=3). (D) A correlation analysis between PD-1 transcript (PDCD1) level and TGF-β1 mRNA level in 384 GC patients from TCGA data set. (E) CD8+ T cells were cultured for 72 hours with 10 ng/mL rhTGF-β1 in the presence of anti-CD3 and anti-CD28 antibodies, and then the expression of PD-1 on CD8+ T cells were analyzed by flow cytometry (n=4). (F) Statistical analysis of the concentrations of TGF-β1 in the TSN and NTSN obtained from 5 GC patients. (G) A correlation analysis between TGF-β1 concentrations and the percentages of PD-1+CD8+ T cells in tumors from 50 GC patients. (H) The expression of PD-1 on CD8+ T cells exposed to 30% TSN with an anti-TGF-β1 neutralizing antibody (10 µg/mL) for 72 hours in the presence of anti-CD3 and anti-CD28 antibodies (n=4). (I) CD8+ T cells were exposed to 30% TSN with an anti-TGF-β1 neutralizing antibody (10 µg/mL) for 72 hours in the presence of anti-CD3 and anti-CD28 antibodies, and their IFN-γ, TNF-α, granzyme B and perforin expressions were determined by flow cytometry (n=3). *p<0.05, **p<0.01: Student’s t test (A, C, E, F, H, I), Spearman’s correlation test (D, G). GC, gastric cancer; NTSN, culture supernatant from digested adjacent non-tumor tissues; PBMCs, peripheral blood mononuclear cells; PD-1, programmed cell death protein 1; TCGA, The Cancer Genome Atlas; TSN, culture supernatant from digested primary GC tumor tissues.

