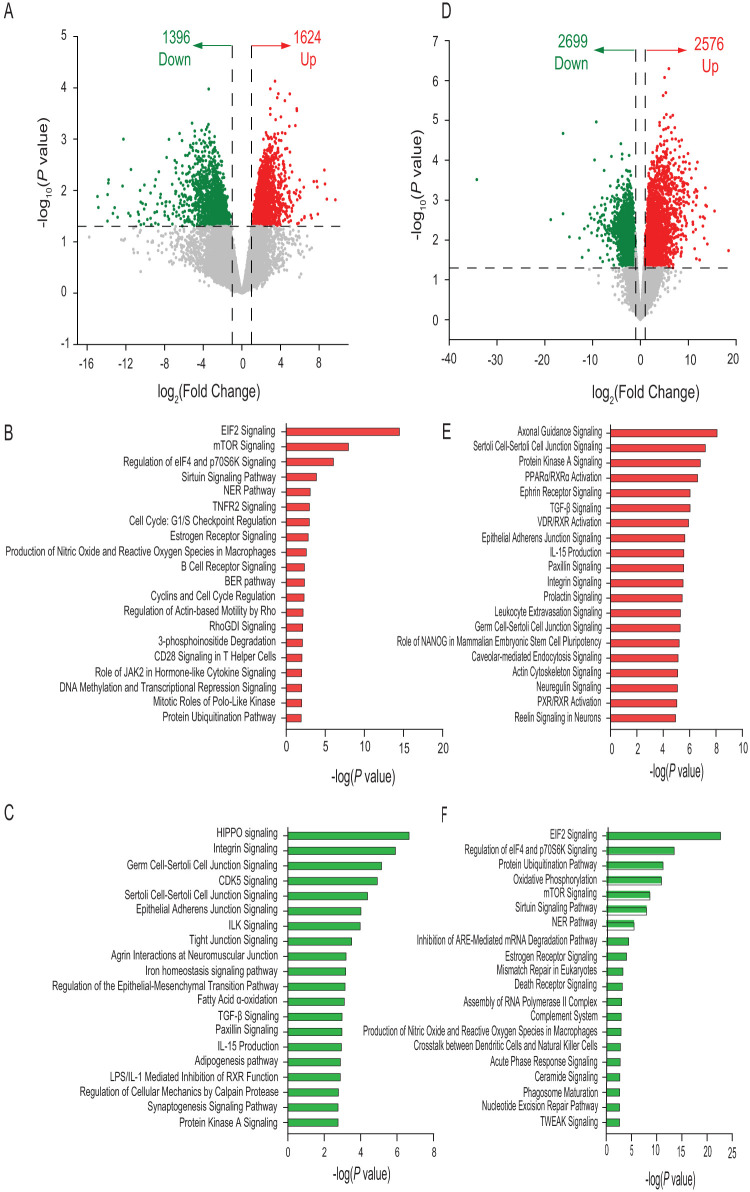
FIG 5.
Differential gene expression in ileal tissues (IL) of male piglets fed milk formula (MF) compared with human milk (HM) from day 2 until day 21 of age. (A) Volcano plot showing genes with decreased (green dots) and increased (red dots) expression in the MF group at day 21 of age. (B) Top 20 canonical pathways in the MF group showing elevated levels at day 21 of age. EIF2/eIF2, eukaryotic initiation factor 2; NER, nucleotide excision repair; BER, base excision repair. (C) Top 20 canonical pathways in the MF group showing decreased levels at day 21 of age. (D) Volcano plot showing genes with genes with decreased (green dots), increased (red dots), and unchanged (gray dots) expression in the MF group at day 51 of age. (E) Top 20 canonical pathways in the MF group showing elevated levels at day 51 of age. (F) Top 20 canonical pathways in the MF group showing decreased levels at day 51 of age. TGF-β, transforming growth factor β.

