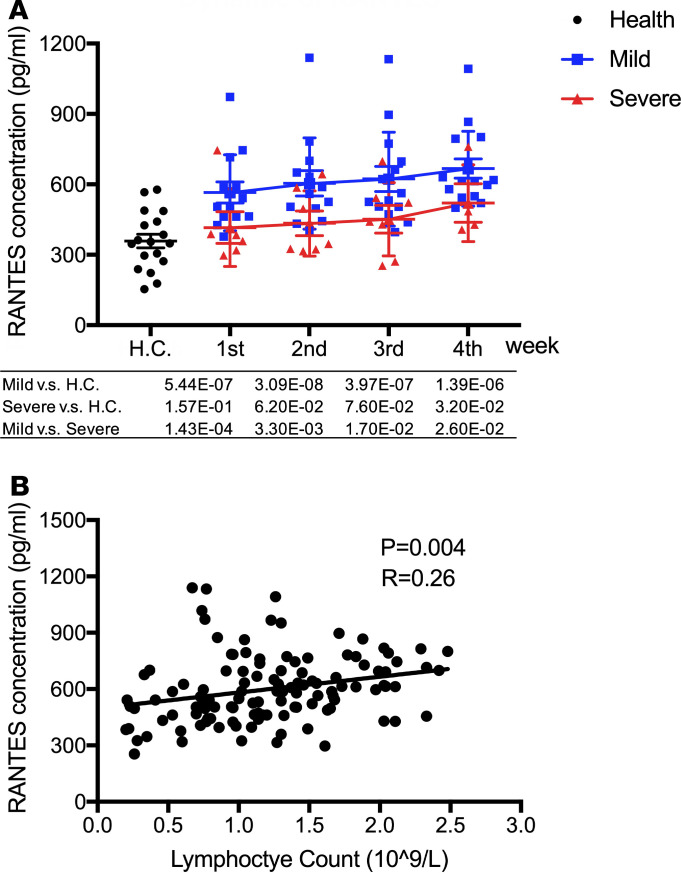
Figure 5. High level of RANTES in mild but not severe COVID-19 patients.
(A) The value of RANTES in severe and mild infection patients and healthy control were compared with each other. Two-tailed Student’s t test was used to compare parametric continuous data (evaluated with Kolmogorov-Smirnov test), and nonparametric t test (Mann-Whitney U test) was used when data were not normally distributed. The differences between each group were presented with a P value in the table under the diagram. The values of RANTES in health control and COVID-19 infection patients in weeks 1–4 of onset of symptom was presented in scatter diagrams, in which health control was represented with black circles, mild patients with blue squares, and severe with red triangles. The dynamics of RANTES was presented with red lines in severe patients and blue lines in mild patients. (B) Correlation analysis between RANTES and lymphocyte counts. Correlation analysis between RANTES and lymphocyte counts was performed by linear regression analysis. Each black circle indicates an individual patient; the linear correlation between RANTES and lymphocyte count was presented with a black line.

