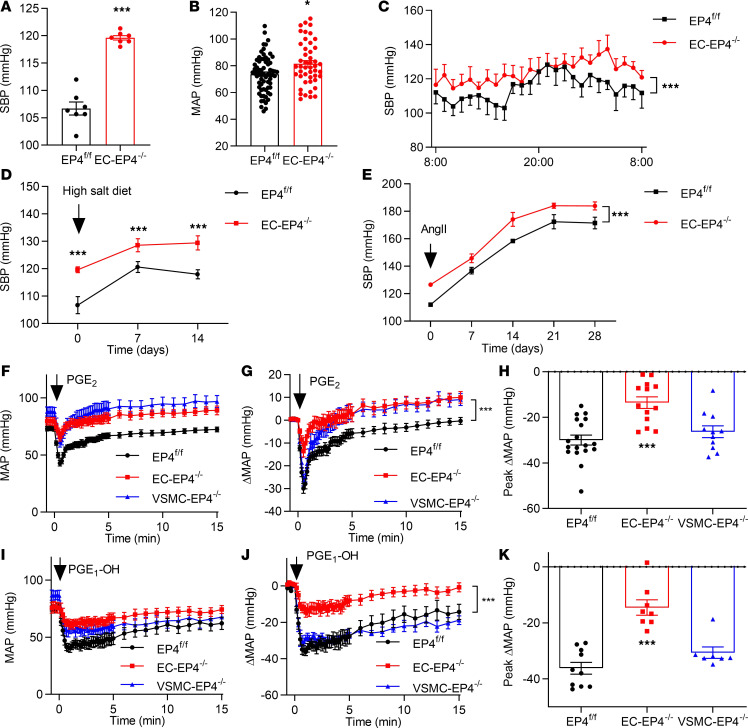
Figure 1. EP4 deletion in ECs elevates BP and compromises the hypotensive effect of PGE2 and agonist PGE1-OH.
(A) Systolic BP (SBP) monitored by tail cuff in conscious EP4fl/fl and EC-EP4–/– mice. ***P < 0.001, n = 7. (B) Mean arterial BP (MAP) recorded by carotid arterial catheterization in anesthetized EP4fl/fl and EC-EP4–/– mice. *P < 0.05, n = 47–69. (C) SBP monitored by implantable radiotelemetry in conscious EP4fl/fl and EC-EP4–/– mice. ***P < 0.001, n = 5. (D) SBP in the EP4fl/fl and EC-EP4–/– mice with continued high-salt diet feeding for 2 weeks. ***P < 0.001, n = 5–7. (E) SBP in the EP4fl/fl and EC-EP4–/– mice with chronic AngII (1000 ng/kg/min) infusion for 4 weeks. ***P < 0.001, n = 11–14. (F) Effect of intravenous infusion of PGE2 (100 μg/kg) on MAP in anesthetized EP4fl/fl, EC-EP4–/–, and VSMC-EP4–/– mice. MAP was measured by carotid arterial catheterization. (G) The net change of MAP after PGE2 infusion. ***P < 0.001 vs. EP4fl/fl, n = 13–18. (H) The maximum net change of MAP in response to PGE2 infusion. ***P < 0.001 vs. EP4fl/fl, n = 13–18. (I) Effect of intravenous infusion of PGE1-OH (100 μg/kg) on MAP in anesthetized EP4fl/fl, EC-EP4–/–, and VSMC-EP4–/– mice as assessed by carotid arterial catheterization. (J) The net change of MAP after PGE1-OH infusion. ***P < 0.001 vs. EP4fl/fl, n = 8–10. (K) The maximum net change of MAP in response to PGE1-OH infusion. ***P < 0.001 vs. EP4fl/fl, n = 8–10. Data are represented as mean ± SEM; 2-tailed Student’s t tests for A, B, and D; 2-way ANOVA tests for C, E, G, and J; 1-way ANOVA followed by Dunnett’s multiple comparisons tests for H and K.

