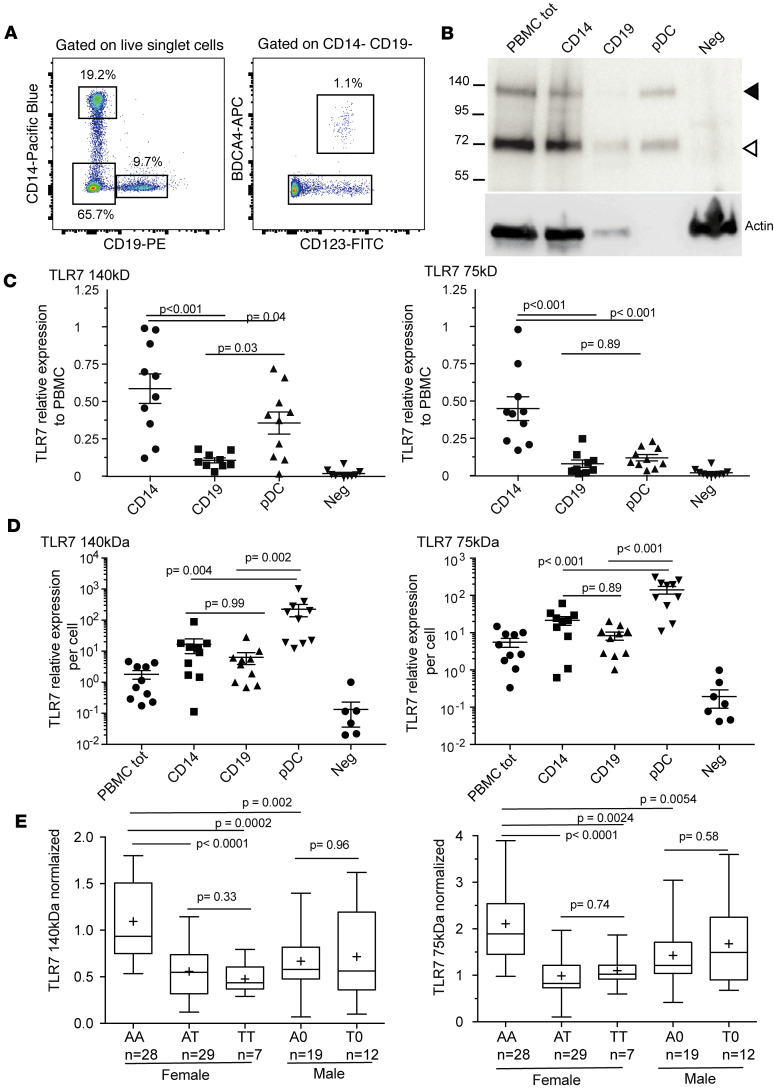
Figure 4. Quantification by Western blotting of TLR7 protein in PBMC subpopulations.
(A) Gating in the flow cytometric isolation from cryopreserved PBMCs of CD14+ monocytes, CD19+ B lymphocytes, CD123+BDCA4+ pDCs, and the CD14−CD19−BDCA4− cell fraction for Western blot analysis. (B) Representative blot for a single human donor. In each lane, the number of cells in the sample was proportional to the relative abundance of the cell type among total PBMCs. Neg, CD14−CD19−BDCA4− cell fraction. (C) Relative contribution from each cell type. Densitometric analysis of TLR7 for 9 different donors. The 140- and 75-kDa forms were quantitated separately and normalized to same-donor signals for total PBMCs. (D) Densitometry normalized to the number of cells represented in each lane, displaying per-cell quantities of TLR7 in the different cell types. (E) TLR7 quantitation in total cryopreserved PBMCs from female or male donors classified by rs179008 genotype. The TLR7 densitometric signal was first normalized to β-actin and then to the corresponding values of a standard PBMC cell lysate as described in Methods. Data presented as a box spanning the 25th to 75th percentiles, with the line in the middle of the box plotted at the median and whiskers going down to the smallest value and up to the largest; “+” denotes the mean. P values from Kruskal-Wallis test corrected for multiple comparisons by controlling the FDR (Benjamini-Hochberg method).

