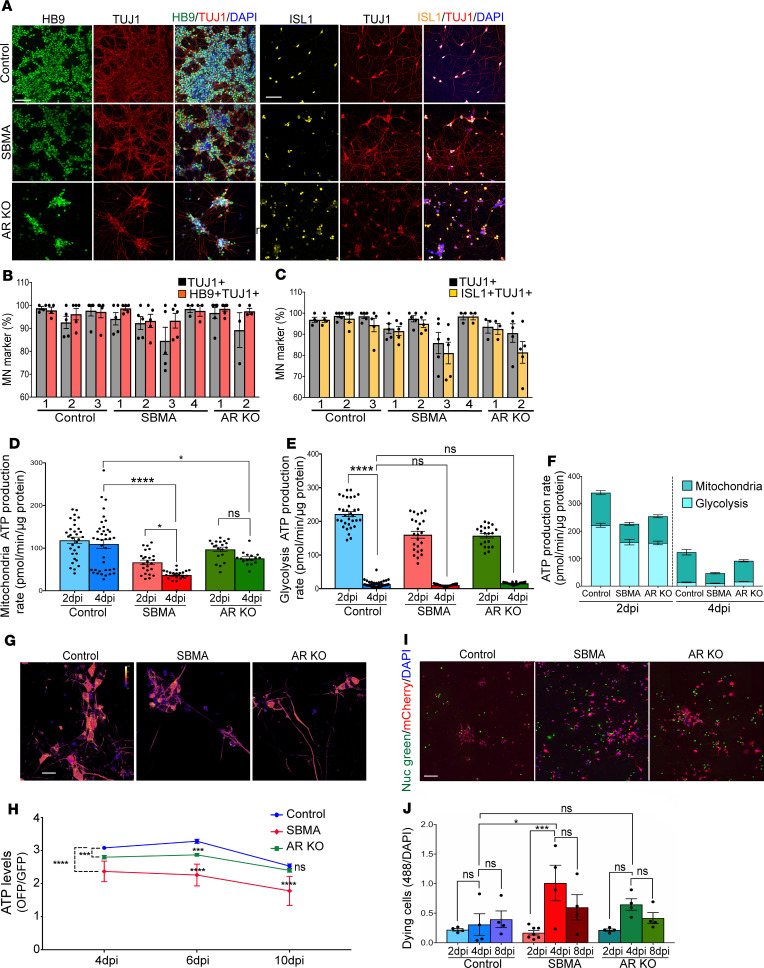
Figure 1. iMNs differentiated from SBMA iPSCs show increased cellular stress and cell death.
(A) Representative images of iMNs (6 dpi) expressing HB9, ISL1, and TUJ1. Scale bars: 75 μm. (B and C) Percentage of HB9+/TUJ1+ (B) and ISL1+/TUJ1+ (C), assessed by immunostaining. n = 4–5 per cell line. (D–F) Bioenergetic extracellular flux analysis (Seahorse assay) on iMNs normalized to total cellular protein concentration. (D) Rate of ATP production during oxidative phosphorylation (MitoATP production rate). (E) Rate of ATP production in the glycolytic pathway (glycoATP production rate). (F) The sum of the glycolytic and mitochondrial ATP production rates (total ATP production rate). n = 16–38 wells/group. (G) Ratiometric pseudocolor images of GoATEAM expressed in iMNs. ATP sensors were introduced into iMNs using lentivirus 4 days before taking the first image. (H) Comparison of orange/green fluorescence emission ratio of GoATEAM at different time points. The ratio was calculated from fluorescence images. Plates were seeded at the same density, and live images were taken from the same plate over time. On average, 30 images per cell line were used for calculating the ratio at each time point. (I) Representative images of dying cells with less plasma membrane integrity were detected with a florescent stain in real time. NucGreen dead 488 (green), iMNs expressing the hNIL-mCherry plasmid (red), and DAPI (blue). (J) Comparison of GFP/DAPI emission ratio of NucGreen dead at different time points. The ratio was calculated from fluorescence images. n = 4–6 per group. All experiments were performed on N = 3 SBMA, N = 3 control, and N = 3 AR-KO. Error bars show mean ± SE; *P < 0.05, ***P < 0.001, ****P < 0.0001. One-way ANOVA followed by Bonferroni’s multiple comparisons test. iMNs were treated with 10 nM DHT. Scale bars: 25 μm (G) and 40 μm (I).

