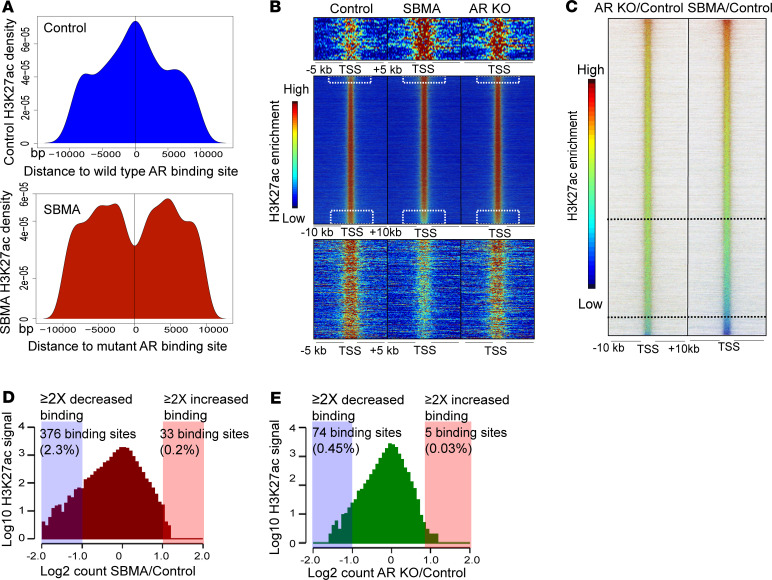
Figure 2. Reduction in H3K27ac binding corresponds to repression in metabolic genes.
(A) H3K27ac peak distribution near WT AR (top) and mutant AR (bottom) peaks. The H3K27ac signal is shown over a scaled window of ± 10 kb from the AR peak. (B) Heatmap of H3K27ac occupancy signals at ± 10 kb region centered around all Refseq TSS ranked by increasing H3K27ac signal intensity in SBMA over control. The height of the heatmap shows 16,118 H3K27ac binding regions across the genome. (C) Ratiometric heatmap comparing H3K27ac signals. Signals are ranked by increased H3K27ac signal intensity in SBMA/control. Demarcated regions represent H3K27ac occupancy signals with greater than 1.5-fold and 2-fold reduced binding. (D and E) Histograms representing 16,118 H3K27ac signals between SBMA/control and ARKO/control. Boxed regions represent H3K27ac binding regions with greater than 2-fold enrichment (red) and greater than 2-fold reduced binding (blue). iMNs were treated with 10 nM DHT.

