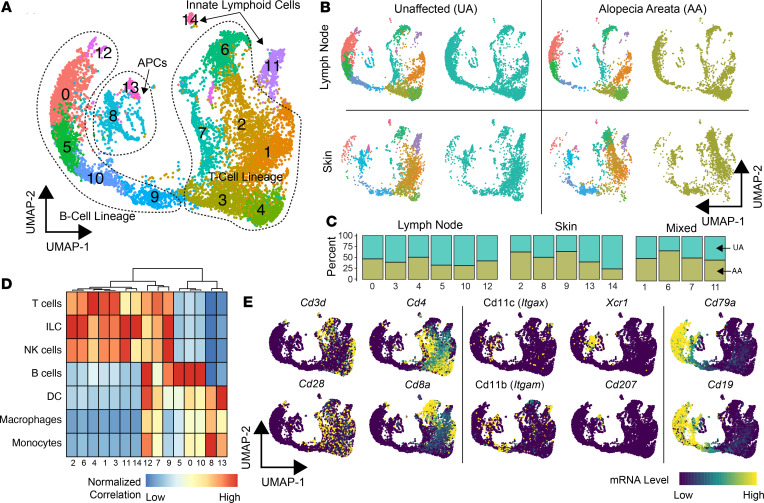
Figure 1. Single-cell immune profiling of m urine skin and lymph node composition in UA controls versus AA.
(A) UMAP plot of the flow-sorted CD45+ murine immune cells from UA (n = 6332) and AA (n = 4173). (B and C) UMAP plots demonstrating the relative distribution of UA and AA, as well as skin and lymph node cells along the UMAP plot (B) and by the breakdown in clusters (C). (D) Normalized correlation values for predicted immune cell phenotypes based on the SingleR R package for each cluster. Cluster of columns based on Euclidean distance between normalized correlation values across all pure immune cell populations in the Immgen database (20). (E) Lineage markers for T cells (Cd3d, Cd4, Cd8a, Cd28), APCs (Itgax, Itgam, Xcr1, Cd207 [Langerin]), and B cells (Cd79a, Cd19).

