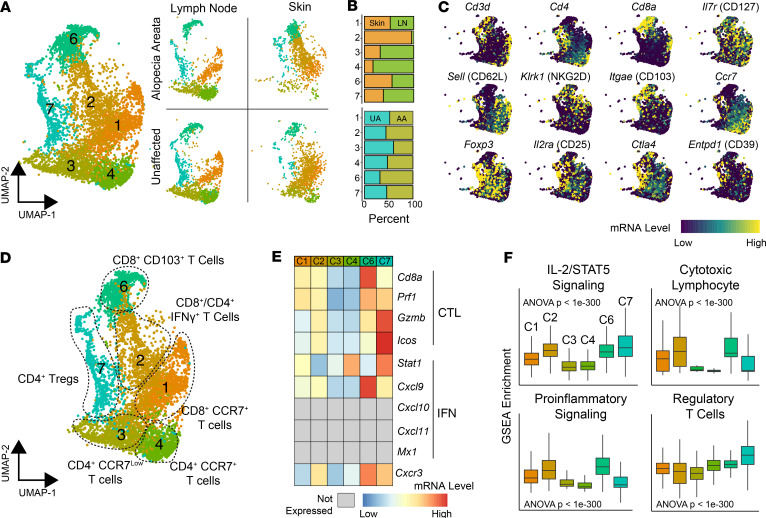
Figure 3. Identification of murine T cell populations in skin and lymph nodes.
(A) Total cell UMAP plot and UMAP separated by tissue and condition for flow-sorted CD45+ murine immune cells focusing on T cell cluster: cluster 1 (n = 1301), cluster 2 (n = 1159), cluster 3 (n = 960), cluster 4 (n = 897), cluster 6 (n = 869), and cluster 7 (n = 681). (B) Relative contribution of cells to each cluster from lymph node versus skin (upper panel) and from UA versus AA samples for all single cells. (C) mRNA expression superimposed on the UMAP plot for general T cell markers (upper and middle rows) and Tregs (bottom row). (D) UMAP plot of the T cell phenotype labels based on gene expression and pathway analysis. (E) Genes from the predictive ALADIN (4) for CTL and IFN. Genes not expressed in T cells are in gray. (F) ssGSEA enrichment scores for selected pathways by T cell cluster; 1-way ANOVA used for comparison across all clusters.

