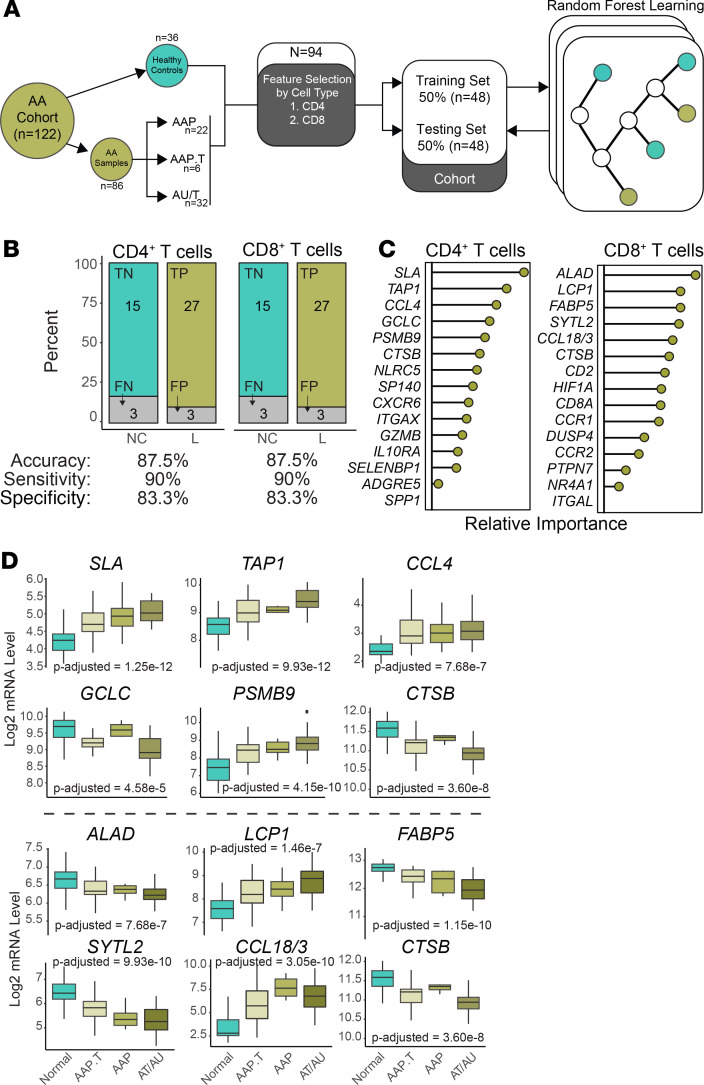
Figure 5. Similar performance of CD4+ T cell and CD8+ T cell gene signatures in the discrimination of AA.
(A) Schematic of signature development using feature selection from 1) 180 CD4+ T cell genes and 2) 669 CD8+ T cell genes. Genes were selected by relative importance and trained using the 48 samples of the training cohort. The random forest models were then applied to the training cohort. (B) Discrimination performance of each model by category (upper bar charts) and measures of accuracy, sensitivity, and specificity. P value less than 0.0001 for both model predictions based on Fisher exact test. (C) Composition of the 15-gene cell type signatures displayed in a ranked variable importance plot. (D) Log2 mRNA expression levels for the top 6 genes by relative importance in the CD4+ (upper panel) and CD8+ gene signatures by disease state: normal, AA transient patchy (AAP.T), patchy AA (AAP), or alopecia totalis and universalis (AT/AU). P values based on 1-way ANOVA with correction based on multiple comparisons.

