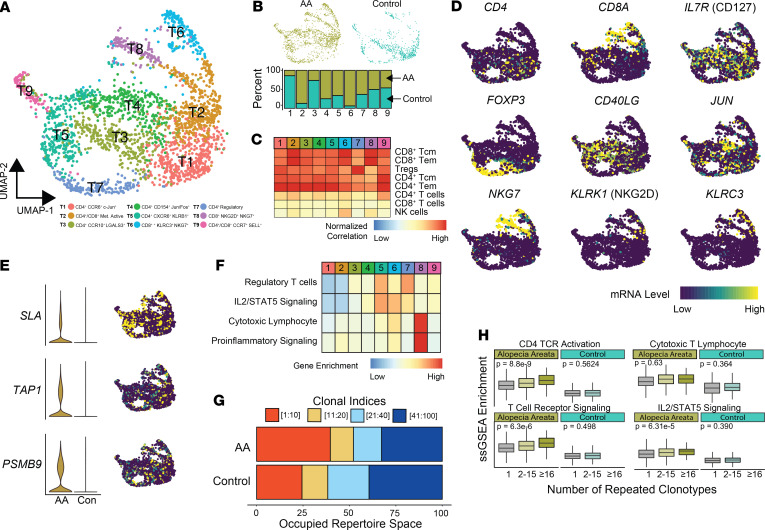
Figure 6. Human single-cell immune profiling of AA T cells recapitulates the findings of the murine analysis.
(A) UMAP plot of the T cell isolated from human AA skin (n = 1664) and control skin (n = 752). (B) Relative contribution of cells to each cluster from normal versus AA samples for all single cells. (C) Normalized correlation values for predicted immune cell phenotypes based on the SingleR R package for each cluster. (D) mRNA expression superimposed on the UMAP plots for lineage and functional markers for T cell populations. (E) Expression comparison and distribution of selected signature markers superimposed on the UMAP plot. (F) Z score–transformed ssGSEA enrichment scores for selected pathways by T cell cluster. (G) The percentage of the top 100 clonotypes that is occupied by the top 1–10, 11–20, 21–40, and 41–100 clones for human AA and control skin. (H) ssGSEA enrichment skin-derived T lymphocytes by grouping the number of repeated clonotypes: 1 (unique clonotypes, AA n = 907, control n = 389), 2–15 (AA n = 262, control n = 122), and 16 or greater (AA n = 51, control n = 0); 1-way ANOVA used for comparison across all clonotype groups.

