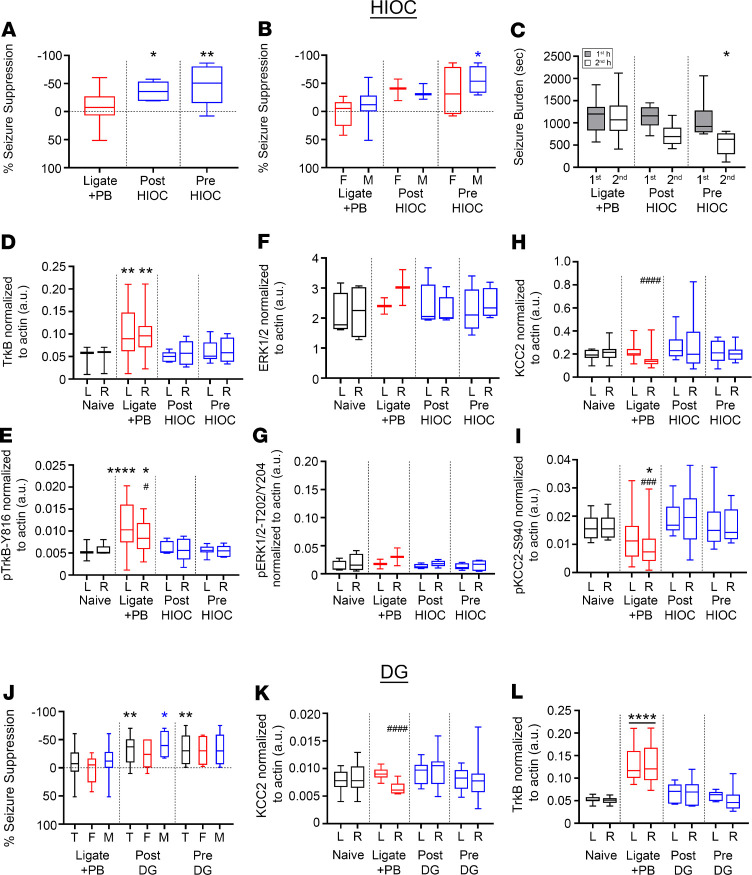
Figure 5. HIOC and DG significantly rescued PB-refractory seizures at P7.
(A) EEG percentage of seizure suppression for ligate+PB–, post-HIOC–, and pre-HIOC–treated P7 pups. *P < 0.05, **P < 0.01 by 1-way ANOVA. Number of mice (EEG): n = 28 [16/12] (ligate+PB [M/F]), 6 [3/3] (post-HIOC), 8 [4/4] (pre-HIOC). (B) EEG percentage of seizure suppression by sex for ligate+PB–, post-HIOC–, and pre-HIOC–treated P7 pups. *P < 0.05 by 2-way ANOVA. (C) EEG seizure burdens for ligate+PB–, post-HIOC–, and pre-HIOC–treated P7 pups. *P < 0.05 by 2-way ANOVA. (D) Contralateral (L) and ipsilateral (R) TrkB expression 24 hours after ischemic insult for all treatment groups. **P < 0.01 by 1-way ANOVA. All proteins were normalized to housekeeping protein β-actin. Number of mice (Western blot): n = 13 [6/7] (naive), 19 [10/9] (ligate+PB), 5 [3/2] (post-HIOC), 6 [4/2] (pre-HIOC). (E) Contralateral (L) and ipsilateral (R) p–TrkB-Y816 expression 24 hours after ischemic insult. *P < 0.05. ****P < 0.0001 by 1-way ANOVA. The # indicates differences between contralateral and ipsilateral hemispheres within groups; #P < 0.05 by 2-tailed t test. (F) Contralateral (L) and ipsilateral (R) ERK1/2 expression 24 hours after ischemic insult. (G) Contralateral (L) and ipsilateral (R) p-ERK1/2-T202/Y204 expression 24 hours after ischemic insult. (H) Contralateral (L) and ipsilateral (R) KCC2 expression 24 hours after ischemic insult. ####P < 0.0001 by 2-tailed t test. (I) Contralateral (L) and ipsilateral (R) p–KCC2-S940 expression 24 hours after ischemic insult. *P < 0.05 by 1-way ANOVA. ###P < 0.001 by 2-tailed t test. (J) EEG percentage of seizure suppression for ligate+PB, post-DG, and pre-DG treatment groups plotted as total data and split by sex. (T, total). *P < 0.05, **P <0.01 by 2-way ANOVA. Horizontal dotted line represents 0% suppression. Number of mice (EEG): n = 28 [16/12] (ligate+PB), 16 [8/8] (post-DG), 15 [10/5] (pre-DG). (K) Contralateral (L) and ipsilateral (R) KCC2 expression 24 hours after ischemic insult. The # signifies hemispheric differences within treatment groups. ####P < 0.0001 by 2-tailed t test. Number of mice (Western blot): n = 13 [6/7] (naive), 19 [10/9] (ligate+PB), 6 [4/2] (post-DG), 7 [4/3] (pre-DG). (L) Contralateral (L) and ipsilateral (R) TrkB expression 24 hours after ischemic insult. ****P < 0.0001 by 1-way ANOVA. Box-and-whisker plots show quartiles with median with minima and maxima at the bottom and top whiskers, respectively.

