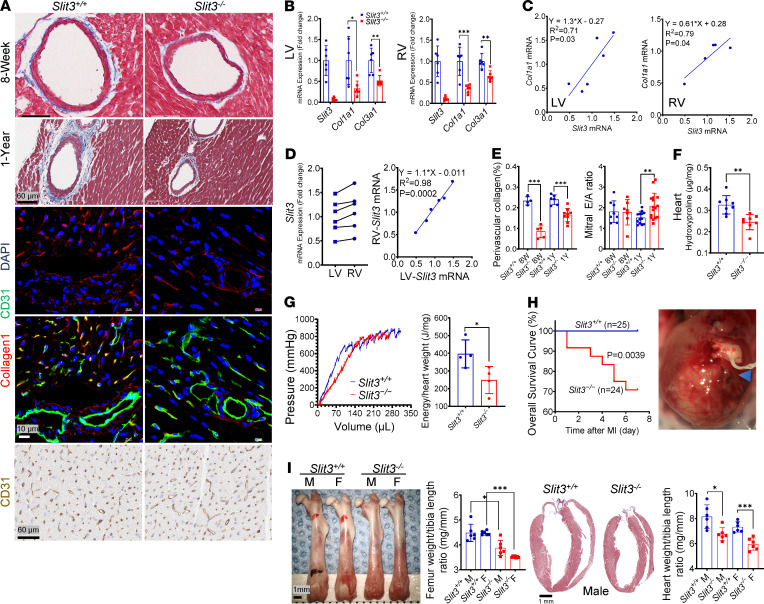
Figure 3. SLIT3 deficiency reduces cardiac fibrillar collagen production and LV biomechanical toughness.
(A) Representative Masson’s trichrome–stained histological sections of heart in 8-week-old and 1-year-old Slit3−/− and WT mice; representative confocal immunofluorescence images of heart stained with collagen type I (red), CD31 (green), and DAPI (blue) in 8-week-old Slit3−/− and WT mice; and representative immunohistochemical stain for CD31 in sections of hearts from 8-week-old Slit3−/− and WT mice (n = 3 per group). (B) Transcript levels of Slit3, Col1a1, and Col3a1 in the left ventricle and right ventricle in 8-week-old Slit3−/− and WT mice (n = 4–6 per group). (C) Linear regression analysis between the transcript levels of Slit3 and Col1a1 in the left ventricle and right ventricle from 8-week-old WT mice (n = 6 per group). (D) Transcript levels of Slit3 in the left and right ventricle, and their linear regression analysis in 8-week-old WT mice (n = 6 per group). (E) Quantification of perivascular collagen area of coronary arteries and mitral ratio of peak early to late diastolic filling velocity (mitral E/A ratio) in 8-week-old and 1-year-old Slit3−/− and WT mice (n = 4–16 per group). (F) Quantification of cardiac collagen content by assessment of hydroxyproline concentrations in 8-week-old Slit3−/− and WT mice (female, n = 8 per group). (G) Representative passive LV pressure-volume curve and quantification of energy density required to rupture the cardioplegia-relaxed left ventricles by balloon catheter inflation in 8-week-old Slit3−/− and WT mice (n = 4 per group). (H) Representative image of myocardial rupture and overall survival curve of the first week after left anterior descending coronary artery ligation (myocardial infarction, MI) in 8-week-old Slit3−/− and WT mice. The blue arrowhead indicates the position of the myocardial rupture hole, and survival analysis was performed using the Kaplan-Meier method. Log-rank test, P = 0.0039 (n = 24–25 per group). (I) Representative image of femurs or hearts, as well as quantification of femur or heart weight/tibia length ratio in 8-week-old Slit3−/− and WT mice (n = 6 per group). Scale bar: 1 mm. Data are presented as mean ± SD. *P < 0.05, **P < 0.01, and ***P < 0.001 vs. WT mice using the unpaired 2-tailed Student’s t test (B, E–G, and I). n, number; M, male; F, female.

