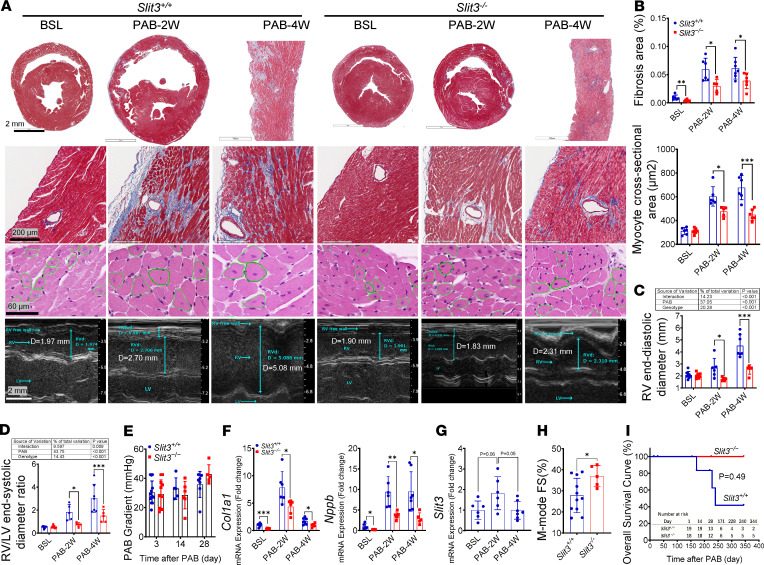
Figure 5. SLIT3 deficiency attenuates RV fibrosis and adverse remodeling.
(A) Histological transverse sections of whole heart or part of RV free wall (first row, Masson’s trichrome stain), and RV free wall with coronary arteries (second row, Masson’s trichrome stain), RV free wall myocytes (third row, hematoxylin and eosin stain) and representative images of RV echocardiogram (fourth row, M-mode parasternal short axis) in Slit3−/− and WT mice before and at 2 and 4 weeks after pulmonary artery banding (PAB) (n = 6). Scale bars: 2 mm, 200 μm, 60 μm, and 2 mm from top to bottom. (B–D) Quantification of RV free wall fibrosis area, myocyte cross-sectional area, as well as end-diastolic diameter area and ratio determined by echocardiogram in Slit3−/− and WT mice before and at 2 and 4 weeks after PAB (n = 4–9 per group). (E) Quantification of PAB peak pressure gradient by echocardiography in Slit3−/− and WT mice at 3, 14, and 28 days after PAB (n = 5–13 per group; initial gradients at day 3, 30 ± 7.9 vs. 29 ± 9.7 mmHg; P > 0.75). (F and G) Transcript levels of Col1a1, Nppb, and Slit3 in the right ventricle in Slit3−/− and WT mice before and at 2 and 4 weeks after PAB (n = 5–6 per group). (H) RV fractional shortening (FS) determined by echocardiography in Slit3−/− and WT mice at 2 weeks after PAB (n = 5–11 per group). (I) Long-term overall survival curve of Slit3−/− and WT mice from day 1 after PAB. Survival analysis was performed using the Kaplan-Meier method. Log-rank test, P = 0.0494 (n = 18–19 per group). Data are presented as mean ± SD. *P < 0.05, **P < 0.01, and ***P < 0.001 vs. WT mice using the unpaired 2-tailed Student’s t test (B, E, and F), 1-way ANOVA with Tamhane T2 multiple comparisons test (G), or 2-way ANOVA with Tukey’s multiple comparisons test (C and D). BSL, 7- to 9-week-old baseline mice before surgery.

