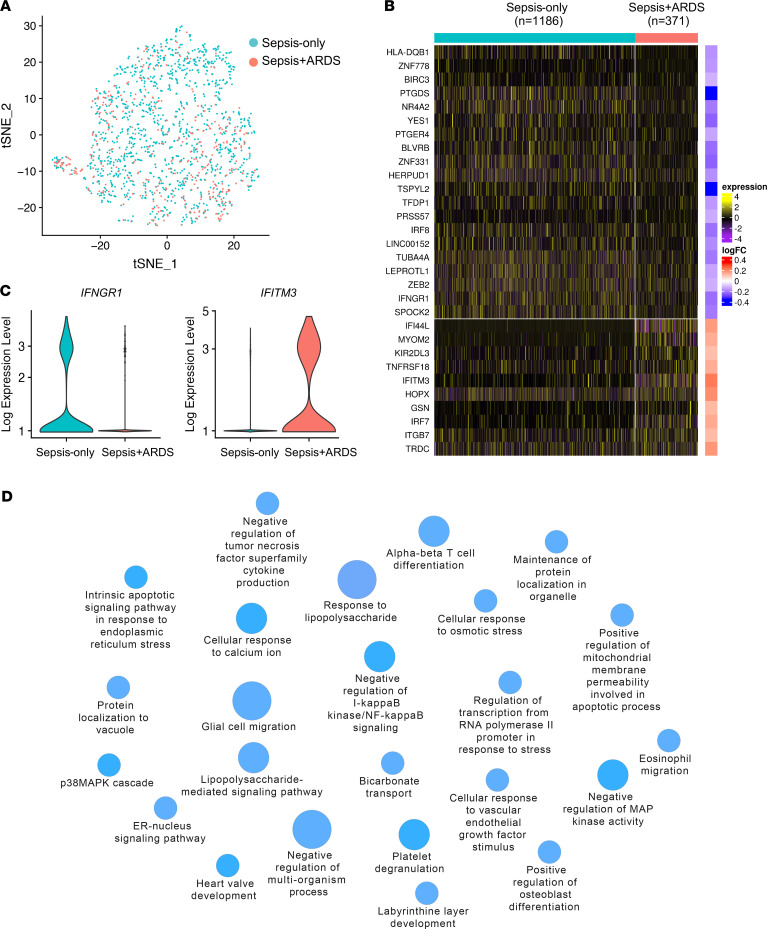
Figure 2. NK cells show a distinct gene expression profile in ARDS patients.
(A) NK cells from sepsis-only (n = 4) and sepsis+ARDS (n = 3) patients are plotted in a t-SNE distribution. (B) The heatmap shows differential gene expression in NK cells in the 2 patient groups. The overall log2FC of combined patient samples is indicated on the right side of the plot. (C) Violin plots of IFNGR1 and IFITM3 in sepsis-only and sepsis+ARDS patients. (D) Significantly downregulated genes in NK cells in ARDS patients were analyzed by ClueGO, with each node representing the identified pathway. The size of the node corresponds to the enrichment significance.

